Understanding ANOVA

ANOVA – or analysis of variance, is a term given to a set of statistical models that are used to analyze differences among groups and if the differences are statistically significant to arrive at any conclusion. The models were developed by statistician and evolutionary biologist Ronald Fischer. To give a very simplistic definition – ANOVA is an extension of the two way T-Test to multiple cases.
Using the same dataset from previous post – the chicken feed one, let us analyze this further. The inference from the boxplot drawn in previous post was that the weight of the chickens is lowest when they are fed horsebean and highest when they are fed casein or sunflower. There were also lots of overlaps in weights. Our objective here is to determine if the average weight of chickens is significantly different based on feed, or is it more or less the same, which means the feed is really not that important to consider? We will define our null hypothesis(the statement to prove or disprove) as the average being the same and hence type of feed has no real consequence.
Null Hypothesis:H0: There is no correlation between feed type and weights.
Alternate Hypothesis:H1: There is significant correlation between feed type and weights.
What ANOVA does is calculate F statistic = Variation among sample means/Variation within groups. The higher the value of this statistic, the greater is the chance that variation among sample means is significant.
Running this simple test on chickwts dataset as below:

anova

From this we can see that the F value is 15.365(Large is > 1), and the p value is really really small(to remember that ‘small’ is <0.05). So we can say with confidence that difference in weights between different feeds is way higher than difference in weight within same feed. In other words feed does appear to have an impact on weight. So we accept the alternate hypothesis.
Taking this one step further – what are the types of feed that cause significant weight differences? To understand this we perform what is called a Tukey’s HSD test, that compares each value to every other and helps us understand which pairs are significant.

It just takes a couple of lines of R code to do this – as below:

anova1

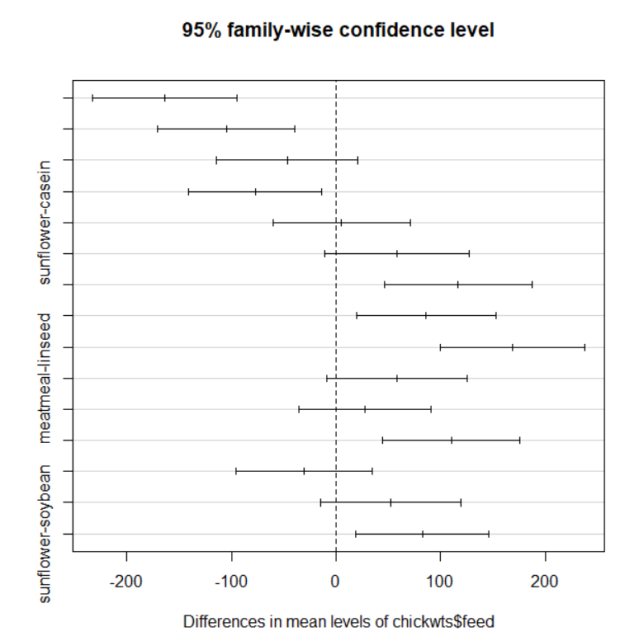
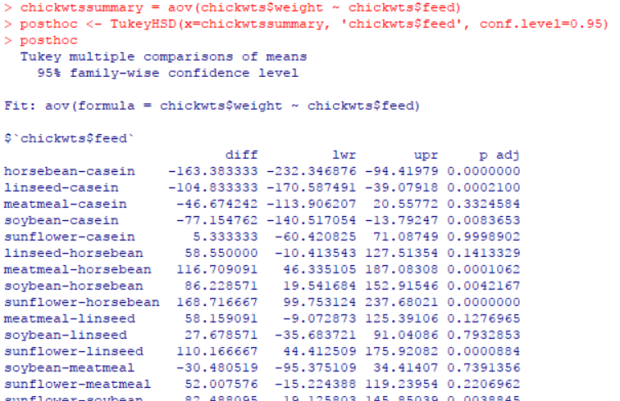
How to read/interpret the results of this test? Let us take the first line. The difference in weight with horsebean and casein is -163, which means casein is 163 points above horsebean. Since the p value is 0, the chances of this being significant are really small, as we can see with lower and upper limit values. So this is really not the pair we are looking for. Going down the list, the ones with significant p values (> 0.05) are meatmeal-casein, sunflower-casein, linseed-horsebean, meatmeal-linseed, soybean-linseed, soybean-meatmeal and sunflower-meatmeal. This can also be drawn in graphical form as below (i could not get R to shorten the text names but the ones beyond 0 are significant). The pairs with significant differences are the ones worthy of pursuit on which feed to adopt. Thanks for reading!

anova3


Box-and-whisker plot and data patterns with R and T-SQL

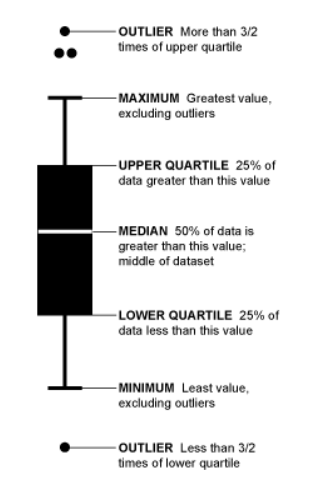
R is particularly good with drawing graphs with data. Some graphs are familiar to most DBAs as it has been things we have seen and used over time – bar charts, pie diagram and so on. Some are not. Understanding exploratory graphics is vitally important to the R programmer/data science newbie. This week I wanted to share what I learned about the box-and-whisker plot, a commonly used graph in R – and one that greatly helps to understand and interpret spread of data. Before getting into specifics of how data is described with this plot, we need to understand a term called Interquartile Range. For each range or subset of data we are involved with (or rather the field we choose to ‘group by’), the middle value is called ‘Median’. The middle of the top 50% of values is called first quartile, and middle of the bottom 50% is called ‘second quartile’. Difference between first and second quartile is called ‘interquartile range’. A box-and-whisker plot helps us to see these values visually – and in addition to this also shows outliers in the data. To borrow a graphic from here – it is as below.
inqr

Now, let us look at the dataset on chicken weights in R with the help of this type of graphic.This is basically a dataset comprising of data on 71 randomly picked chickens, who were fed six different types of feed. Their weight was then observed and compiled. Let us say we sort this data from minimum to maximum weight for each feed.

You need the mosaic R package installed, which in turn has a few dependencies – dplyr, mosaicData,ggdendro and  ggformula. You can install each of these packages with the command install.packages(“<package name”, repos = http://mran.revolutionanalytics.com&#8221;) and then issue below command for pulling up with B-W plot.

library("mosaic")
bwplot(weight~feed, data=chickwts, xlab="Feed type", ylab="Chickem weight at six weeks (g)")

Results are as below:

chickfeed

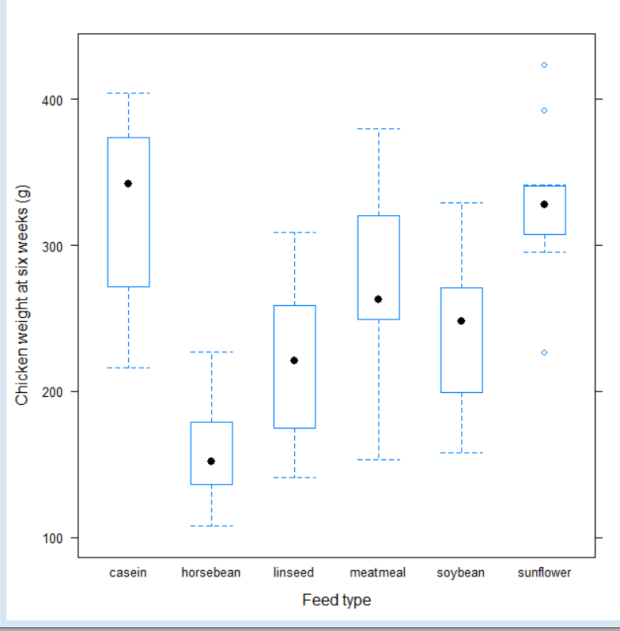
With this we are easily able to see that
1 Feed type casein produces chickens with maximum weight
2 Feed type horsebean produces chickens with minimum weight
3 Feedtype sunflower has some outliers which don’t seem to match general pattern of data
4 The distribution of weights within each feed type seem fairly symetric.
5 There are also many overlapping weights across feed types.

To get to some of the numbers accurately you can just say

favstats(weight~feed, data=chickwts)

rstats

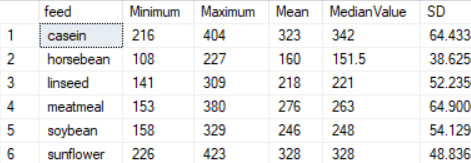
If you wish to get some of these values in T-SQL (i imported this data into SQL server via excel) – you can use query below. Comparing the values visually with graph will show that they are similar.

SELECT DISTINCT ck.feed,MIN(weight) OVER (PARTITION BY ck.feed) AS Minimum, Max(weight) OVER (PARTITION BY ck.feed) AS Maximum, 
AVG(weight) OVER (PARTITION BY ck.feed) AS Mean,
PERCENTILE_CONT(0.5) WITHIN GROUP (ORDER BY ck.weight)OVER (PARTITION BY ck.feed) AS MedianValue,
STDEV(weight) OVER (PARTITION BY ck.feed) AS SD
FROM chickfeed ck ORDER BY feed;

Results are as below:

sql

The math for Q1 and Q3 are a little complicated in T-SQL, I was unsure if it was worth doing since that is not the point of my blog post. You can find info on it here

As we can see, the numbers tie up regardless of which way we do it. But it is much harder though to find patterns and outliers using code. The graph is undoubtedly more useful in this regard.

In the next post we will look into applying some analysis of variance (ANOVA) to examine if the difference in weights across feed types is really significant to arrive at any conclusion on nature of the feed. Thanks for reading!


Confidence Intervals for a proportion – using R

What is the difference between reading numbers as they are presented, and interpreting them in a mature, deeper way? One way perhaps to look at the latter is what statisticians call ‘confidence interval’.

Suppose I look at a sampling of 100 americans who are asked if they approve of the job the supreme court is doing. Let us say for simplicity’s sake that the only two answers possible are yes or no. Out of 100, say 40% say yes. As an ordinary person, you would think 40% of people just approve. But a deeper answer would be – the true proportion of americans who approve of the job the supreme court is doing is between x% and y%.

How confident I am that it is?  About z%. (the common math used is 95%).  That is an answer that is more reflective of the uncertainty related to questioning people and taking the answers to be what is truly reflective of an opinion. The x and y values make up what is called a ‘confidence interval’.

Let us illustrate this with an example.

From this article  – out of a random sampling of 1089 people, 41% approved of the job the supreme court was doing. To construct the confidence interval, the first step is to determine if this sampling satisfies the needs for a normal distribution.
Step 1: Is the data from a normal distribution?
When we do not have the entire dataset with us, we use the below two rules to determine this:
1 The sample observations are independent – from the article it seems like random people were selected so this is safe to assume.
2 We need a minimum of 10 successes and 10 failures in the sample. – ie np >=10 and n(1-p) >= 10. This is called ‘success failure condition‘. Our n here is 1089, and p is 0.41. So successes are 1089*41 = 446.49 and failures are 642.5. Both are larger than 10, so we are good.
Step 2: Calculate standard error  or standard deviation of the confidence interval is calculated as square root of p(1-p)/n. In this case it is square root of 0.41*0.59/1089 which is 0.0149.
Step 3: Find the right critical value to use – we want a 95% confidence in our estimates, so the critical value recommended for this is 1.96.
Step 4: Calculate confidence interval – Now we have all we need to calculate confidence interval. The formula to use is point estimate +- (critical value x standard error) which is 0.41 + (1.96*0.0149)  = 0.4392, and 0.41 – (1.96*0.0149) = 0.3807.
So, we can say with 95% confidence that the true proportion of americans who approve of the supreme court is between 38.07% and 43.92%.

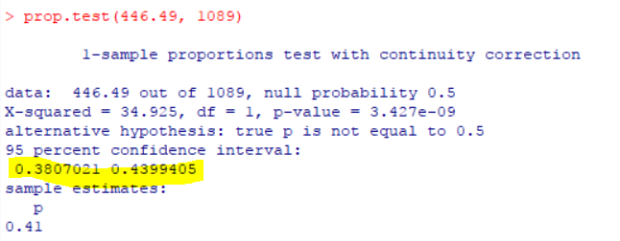
We can spare ourselves all this trouble by using a simple function in R as below, and we get the same results. We need to pass to this function what is 41% of 1089, which is 446.49.

Just typing prop.test(446.49, 1089) gets answers as below:

pic

So, with just two figures – the sample count and percentage value, we were able to derive a deeper conclusion of what this data might mean. Thanks for reading!


Understanding Relative Risk – with T-SQL

In this post we will explore a common statistical term – Relative Risk, otherwise called Risk Factor. Relative Risk is a term that is important to understand when you are doing comparative studies of two groups that are different in some specific way. The most common usage of this is in drug testing – with one group that has been exposed to medication and one group that has not. Or , in comparison of two different medications with two groups with each exposed to a different one.
To understand better am going to use the same example that I briefly referenced in my earlier post.

a1

In this case the risk of a patient treated with Drug A developing asthma is 56/100 = 0.56. Risk of patient treated with drug B developing asthma is 32/100 = 0.32. So the relative risk is 0.56/0.32 which is 1.75. Absolute Risk, is another term which is the difference in probabilities of the two cases(0.56-0.32). There are some posts that argue that absolute risk should be used while comparing two medications and relative risk for one medication versus none at all but this is not a hard rule and there are many variations.

This wikipedia post has a great summary of relative risk – make sure to read the link they have on absolute risk also.

Now, applying relative risk to the problem we were trying to solve in the earlier post – we have two groups of data as below.

a3

The relative risk in the first case is (32/40)/(24/60) = 2. In the second group it is (24/60)/(8/40) = 2. So logically when we combine(add) the two groups we should still get a relative risk of 2. But we get 1.75, as we saw with the first set of data above. The reason for that skew is because of the age factor, also called the confounding variable. We used the cochran-mantel test to mitigate the effect of the age factor to calculate x2 and pi value for the same data. We can use the same test to calculate relative risk by obscuring the age factor – the formula for doing this is as below (with due thanks to the text book on Introductory Applied Biostatistics.
relativerisk

Using the formula on the data in T-SQL (you can find the dataset to use here) –

declare @Batch2DrugAYes numeric(18,2), @Batch2DrugANo numeric(18,2), @Batch2DrugBYes numeric(18, 2), @Batch2DrugBNo numeric(18, 2)
declare @riskratio numeric(18, 2), @riskrationumerator numeric(18, 2), @riskratiodenom numeric(18,2 )
declare @totalcount numeric(18, 2)

SELECT @totalcount = count(*) FROM [dbo].[DrugResponse] WHERE batch = 1
SELECT @Batch1DrugAYes = count(*) FROM [dbo].[DrugResponse] WHERE batch = 1 AND drug = 'A' AND response = 'Y'
SELECT @Batch1DrugANo = count(*) FROM [dbo].[DrugResponse] WHERE batch = 1 AND drug = 'A' AND response = 'N'
SELECT @Batch1DrugBYes = count(*) FROM [dbo].[DrugResponse] WHERE batch = 1 AND drug = 'B' AND response = 'Y'
SELECT @Batch1DrugBNo = count(*) FROM [dbo].[DrugResponse] WHERE batch = 1 AND drug = 'B' AND response = 'N'

SELECT @Batch2DrugAYes = count(*) FROM [dbo].[DrugResponse] WHERE batch = 2 AND drug = 'A' AND response = 'Y'
SELECT @Batch2DrugANo = count(*) FROM [dbo].[DrugResponse] WHERE batch = 2 AND drug = 'A' AND response = 'N'
SELECT @Batch2DrugBYes = count(*) FROM [dbo].[DrugResponse] WHERE batch = 2 AND drug = 'B' AND response = 'Y'
SELECT @Batch2DrugBNo = count(*) FROM [dbo].[DrugResponse] WHERE batch = 2 AND drug = 'B' AND response = 'N'

SELECT @riskrationumerator = (@Batch1DrugAYes*(@Batch1DrugBYes+@Batch1DrugBNo))/@totalcount
SELECT @riskrationumerator = @riskrationumerator + (@Batch2DrugAYes*(@Batch2DrugBYes+@Batch2DrugBNo))/@totalcount

SELECT @riskratiodenom = (@Batch1DrugBYes*(@Batch1DrugAYes+@Batch1DrugANo))/@totalcount
SELECT @riskratiodenom = @riskratiodenom + (@Batch2DrugBYes*(@Batch2DrugAYes+@Batch2DrugANo))/@totalcount
--SELECT @riskratiodenom
--SELECT @riskrationumerator,@riskratiodenom
SELECT 'Adjust Risk Ratio: ', @riskrationumerator/@riskratiodenom

riskratio

We can write code in R to achieve above result – there is no in built function to do this as far as I can see. But when we can write simpler code in T-SQL I was not sure if it worth the trouble to do it for this particular case. We have at least one scenario we can do something easily in T-SQL that R does not seem to have built-in. I certainly enjoyed that feeling!! Thanks for reading.


Cochran-Mantel-Haenzel Method with T-SQL and R – Part I

This test is an extension of the Chi Square test I blogged of earlier. This is applied when we have to compare two groups over several levels and comparison may involve a third variable.
Let us consider a cohort study as an example – we have two medications A and B to treat asthma. We test them on a randomly selected batch of 200 people. Half of them receive drug A and half of them receive drug B. Some of them in either half develop asthma and some have it under control. The data set I have used can be found here. The summarized results are as below.
a1

To understand this data better, let us look at a very important statistical term – Relative Risk .It is the ratio of two probabilities.That is, the Risk of patient developing asthma with Medication A/Risk of patient developing asthma with medication B. In this case the risk of a patient treated with Drug A developing asthma is 56/100 = 0.56. Risk of patient treated with drug B developing asthma is 32/100 = 0.32. So the relative risk is 0.56/0.32 which is 1.75.

Let us assume a theory/hypothesis then, that there is no significant difference in developing asthma from taking drug A versus taking drug B. Or in other words, that comparative relative risk from the two medications is the same, or that their ratio is 1. We can test this hypothesis using Chi Square test in R. (If you want the long winded T-SQL way of doing the Chi Square test refer to my blog post here. The goal of this post is to go further than that so am not repeating this using T-SQL, just using R for this step).

mymatrix3 <- matrix(c(56,44,32,68),nrow=2,byrow=TRUE)
colnames(mymatrix3) <- c("Yes","No")
rownames(mymatrix3) <- c("A", "B")
chisq.test(mymatrix3)

a2

Since the p value is significantly less than 0.05, we can conclude with 95% certainty that the null hypothesis is false and the two medications have different effects, not the same.

Now, let us take it one step further. Inspection of the data reveals that people selected randomly for the test fall broadly into two age groups, below 65 and over or equal to 65. Let us call these two age groups 1 and 2. If we separate the data into these two groups it looks like this.
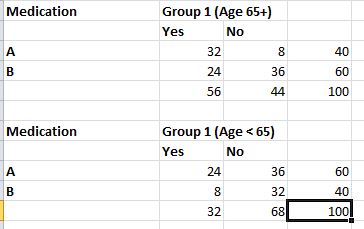
a3

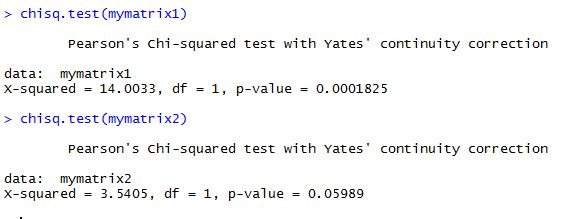
Running the chi square test on both of these datasets, we get results like this :

mymatrix1 <- matrix(c(32,8,24,36),nrow=2,byrow=TRUE)
colnames(mymatrix1) <- c("Yes","No")
rownames(mymatrix1) <- c("A","B")
chisq.test(mymatrix1)

mymatrix2 <- matrix(c(24,36,8,32),nrow=2,byrow=TRUE)
colnames(mymatrix2) <- c("Yes","No")
rownames(mymatrix2) <- c("A", "B")
myarray <- array(c(mymatrix1,mymatrix2),dim=c(2,2,2))
chisq.test(mymatrix2)
a3

In the second dataset for people of age group < 65, we can see that the p value is greater than 0.05 thus proving the null hypothesis right. In other words, when the data is split into two groups based on age, the original assumption does not hold true. Age, in this case, becomes the confounding variable or the variable that changes the conclusions we draw from the dataset. The chi square test shows results that take into account the age variable. These results are not wrong but do not tell us if the two datasets are related for -specifically- for the the two variables we are looking for – drug used and nature of response.
To test for the independence of two variables and mute the effect of the confounding variable with repeated measurements, the Cochran-Mantel-Haenszel test can be used. If you  have a matrix as below , the formula for x-squared/pi value for this test is

The above image is used with thanks from the book Introductory Applied Biostatistics.

Using T-SQL: I used the same formula as the textbook, only added the correction of 0.5 to the numerator, since R uses the correction automatically and we want to compare results to R.(Disclaimer: To be aware that I have intentionally done this step-by-step for the sake of clarity, and not tried to optimize T-SQL by doing it shortest way for this. It is my humble opinion that these calculations are best done using R – T-SQL is a backup method and a good means to understand what goes behind the formula, nothing more.)

declare @Batch1DrugAYes numeric(18,2), @Batch1DrugANo numeric(18,2), @Batch1DrugBYes numeric(18, 2), @Batch1DrugBNo numeric(18, 2)
declare @Batch2DrugAYes numeric(18,2), @Batch2DrugANo numeric(18,2), @Batch2DrugBYes numeric(18, 2), @Batch2DrugBNo numeric(18, 2)
declare @xsquared numeric(18, 2), @xsquarednumerator numeric(18, 2), @xsquareddenom numeric(18,2 )
declare @totalcount numeric(18, 2)

SELECT @totalcount = count(*) FROM [dbo].[DrugResponse] WHERE batch = 1
SELECT @Batch1DrugAYes = count(*) FROM [dbo].[DrugResponse] WHERE batch = 1 AND drug = 'A' AND response = 'Y'
SELECT @Batch1DrugANo = count(*) FROM [dbo].[DrugResponse] WHERE batch = 1 AND drug = 'A' AND response = 'N'
SELECT @Batch1DrugBYes = count(*) FROM [dbo].[DrugResponse] WHERE batch = 1 AND drug = 'B' AND response = 'Y'
SELECT @Batch1DrugBNo = count(*) FROM [dbo].[DrugResponse] WHERE batch = 1 AND drug = 'B' AND response = 'N'

SELECT @Batch2DrugAYes = count(*) FROM [dbo].[DrugResponse] WHERE batch = 2 AND drug = 'A' AND response = 'Y'
SELECT @Batch2DrugANo = count(*) FROM [dbo].[DrugResponse] WHERE batch = 2 AND drug = 'A' AND response = 'N'
SELECT @Batch2DrugBYes = count(*) FROM [dbo].[DrugResponse] WHERE batch = 2 AND drug = 'B' AND response = 'Y'
SELECT @Batch2DrugBNo = count(*) FROM [dbo].[DrugResponse] WHERE batch = 2 AND drug = 'B' AND response = 'N'

SELECT @xsquarednumerator = ((@Batch1DrugAYes*@Batch1DrugBNo) - (@Batch1DrugANo*@Batch1DrugBYes))/100
SELECT @xsquarednumerator = @xsquarednumerator + ((@Batch2DrugAYes*@Batch2DrugBNo) - (@Batch2DrugANo*@Batch2DrugBYes))/100
SELECT @xsquarednumerator = SQUARE(@xsquarednumerator-0.5)

SELECT @xsquareddenom = ((@Batch1DrugAYes+@Batch1DrugANo)*(@Batch1DrugBYes+@Batch1DrugBNo)*(@Batch1DrugAYes+@Batch1DrugBYes)*(@Batch1DrugANo+@Batch1DrugBNo))/(SQUARE(@TOTALCOUNT)*(@totalcount-1))
SELECT @xsquareddenom = @xsquareddenom + ((@Batch2DrugAYes+@Batch2DrugANo)*(@Batch2DrugBYes+@Batch2DrugBNo)*(@Batch2DrugAYes+@Batch2DrugBYes)*(@Batch2DrugANo+@Batch2DrugBNo))/(SQUARE(@TOTALCOUNT)*(@totalcount-1))
--SELECT @xsquareddenom
--SELECT @xsquarednumerator,@xsquareddenom
SELECT 'Chi Squared: ', @xsquarednumerator/@xsquareddenom


c1

We get a chi square value of 17.17. With T-SQL it is hard to take it further than that, so we have to stick this value into a calculator to get the corresponding p-value. The P-Value is 3.5E-05. The result is significant at p < 0.05. What this means in lay man terms is that the two datasets have differences that are statistically significant in nature and that the null hypothesis that says they are the same statistically is false.

Trying to do the same thing in R is very easy –

mymatrix1 <- matrix(c(32,8,24,36),nrow=2,byrow=TRUE)
colnames(mymatrix1) <- c("Yes","No")
rownames(mymatrix1) <- c("A","B")
 
mymatrix2 <- matrix(c(24,36,8,32),nrow=2,byrow=TRUE)
colnames(mymatrix2) <- c("Yes","No")
rownames(mymatrix2) <- c("A", "B")
myarray <- array(c(mymatrix1,mymatrix2),dim=c(2,2,2))
mantelhaen.test(myarray)

Results are as below and almost identical to what we found with T-SQL. Hence the conclusion drawn is valid, that the two datasets are different regardless of age.


m1

In the next post I will cover the calculation of relative risk with this method. Thank you for reading.

Fischer’s Exact Test – with T-SQL and R

This post is a long overdue second part to the post on Chi Square Test that I did a few months ago.  This post addresses relationships between two categorical variables, but in cases where data is sparse, and the numbers (in any cell) are less than 5. The Chi Square test is to be used when numbers are higher than 5, but what if you have a problem with smaller numbers, and you want to find the connection between variables involved, or if there is a connection involved? To study this i picked a simple example from our SQL Saturday data. I have a very simple matrix like below. This tells me count of speakers, by gender, and separated as new (new to our event, not new entirely), and repeat, those who have attended our event.

Speakers New Repeat Row Total
Male 2 11 13
Female 1 2 3
Column Total 3 13 16

Step 1 – Setup Hypothesis: What is the question am trying to answer?  – if I were to choose 3 new speakers at random, say – what is the probability that a minimum of 1 of them will be a woman? Another more simplified way of stating the same problem is – Is there a correlation between gender and number of new speakers? From a statistical perspective, the assumption is a ‘no’ to begin with. (also called Null Hypothesis). If we disprove this statement, we prove the opposite – that there is a relationship. If not, there isn’t. So putting it down:
H0, or Null hypothesis : There is no correlation between gender and new speaker count that is statistically significant.
H1: The alternate hypothesis: There is a correlation between gender and new speaker count that is statistically significant.
What do both of these statements mean mathematically, or in other words , what would be the basis on which we make this decision? We can look at that in Step 3.

Step 2: Set up the appropriate test statistic: We choose to use Fischer’s test because of the sparse number of values we have, and also because our variables of choice are categorical.

Step 3: How do i decide? : The decision rule in two sample tests of hypothesis depends on three factors :
1 Whether the test is upper, lower or two tailed (meaning the comparison is greater, lesser or both sides of gender and speaker count)
2 The level of significance or degree of accuracy needed,
3 The form of test statistic.
Our test here is to just find out if gender and speaker count are related so it is a two tailed test. The level of significance we can use is the most commonly used 95% which is also the default in R for Fischer’s Test. The form of the test statistic is P value. So our decision rule would be that gender and speaker category are related if P value is less than 0.05.

Step 4: Calculation

Now, time to do the math...first, with R:
Input =(" Speaker New Repeat
 Male 2 11
 Female 1 2
 ")
 
 TestData = as.matrix(read.table(textConnection(Input),
 header=TRUE, row.names=1))
fisher.test(TestData,alternative="two.sided")

fischers

R is telling us that the p value is 0.4893. way above 0.05. And hence per our decision rule the two elements are not correlated based on the sparse data we have.

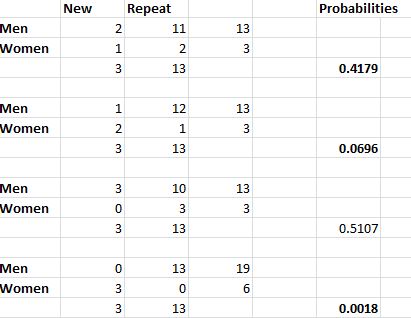
Now let us try the same thing with T-SQL. The calculation for Fischer’s test is rather elaborate when done manually – which is where you can appreciate how elegant and easy it is to use built-in functions with R. To do it otherwise, you need to not only code the calculation, but also come up with different possibilities of the same matrix. That is those that total up the same row and column wise. Then calculate the probabilities on each of them and sum those probabilities that are less than the ‘base probability’, or the one we derive from the base matrix. In this case we have 4 possible matrices as below, and each of the their probabilities (calculated with T-SQL) and as shown

Fischers1

T-SQL to calculate probabilities: All probability related math needs calculation of factorials. For this purpose I used the method described by Jeff Moden here.

DECLARE @newmen int , @newwomen int
, @repeatmen int , @repeatwomen int

DECLARE @pvalue numeric(18, 4)
DECLARE @numerator1 float,@numerator2 float,@numerator3 float,@numerator4 float,@numerator5 float 
DECLARE @denominator1 float,@denominator2 float,@denominator3 float,@denominator4 float,@denominator5 float

SELECT @newmen = 2, @newwomen = 1, @repeatmen = 11, @repeatwomen = 2


SELECT @numerator1 = [n!] FROM [dbo].[Factorial] WHERE N = (@newmen+@newwomen)
--select @newmen+@newwomen
SELECT @numerator2 = [n!] FROM [dbo].[Factorial] WHERE N = (@repeatmen+@repeatwomen)
--select @repeatmen+@repeatwomen

SELECT @numerator3 = [n!] FROM [dbo].[Factorial] WHERE N = (@newmen+@repeatmen)
--select @newmen+@repeatwomen

SELECT @numerator4 = [n!] FROM [dbo].[Factorial] WHERE N = (@newwomen+@repeatwomen)
--select @newwomen+@repeatmen

--select @numerator1, @numerator2, @numerator3, @numerator4
SELECT @denominator1 = [n!] FROM [dbo].[Factorial] WHERE N = @newmen
SELECT @denominator2 = [n!] FROM [dbo].[Factorial] WHERE N = @newwomen
SELECT @denominator3 = [n!] FROM [dbo].[Factorial] WHERE N = @repeatmen
SELECT @denominator4 = [n!] FROM [dbo].[Factorial] WHERE N = @repeatwomen
SELECT @denominator5 = [n!] FROM [dbo].[Factorial] WHERE N = (@newmen+@newwomen+@repeatmen+@repeatwomen)
SELECT @pvalue = (@numerator1*@numerator2*@numerator3*@numerator4)/(@denominator1*@denominator2*@denominator3*@denominator4*@denominator5)
--select @denominator1, @denominator2, @denominator3, @denominator4, @denominator5
SELECT 'Matrix 1 - Pcutoff' as Matrix, @pvalue as PValue


SELECT @newmen = 1, @newwomen = 2, @repeatmen = 12, @repeatwomen = 1

SELECT @numerator1 = [n!] FROM [dbo].[Factorial] WHERE N = (@newmen+@newwomen)
--select @newmen+@newwomen
SELECT @numerator2 = [n!] FROM [dbo].[Factorial] WHERE N = (@repeatmen+@repeatwomen)
--select @repeatmen+@repeatwomen

SELECT @numerator3 = [n!] FROM [dbo].[Factorial] WHERE N = (@newmen+@repeatmen)
--select @newmen+@repeatwomen

SELECT @numerator4 = [n!] FROM [dbo].[Factorial] WHERE N = (@newwomen+@repeatwomen)
--select @newwomen+@repeatmen

--select @numerator1, @numerator2, @numerator3, @numerator4
SELECT @denominator1 = [n!] FROM [dbo].[Factorial] WHERE N = @newmen
SELECT @denominator2 = [n!] FROM [dbo].[Factorial] WHERE N = @newwomen
SELECT @denominator3 = [n!] FROM [dbo].[Factorial] WHERE N = @repeatmen
SELECT @denominator4 = [n!] FROM [dbo].[Factorial] WHERE N = @repeatwomen
SELECT @denominator5 = [n!] FROM [dbo].[Factorial] WHERE N = (@newmen+@newwomen+@repeatmen+@repeatwomen)
SELECT @pvalue = (@numerator1*@numerator2*@numerator3*@numerator4)/(@denominator1*@denominator2*@denominator3*@denominator4*@denominator5)
--select @denominator1, @denominator2, @denominator3, @denominator4, @denominator5
SELECT 'Matrix 2' as Matrix, @pvalue as PValue


SELECT @newmen = 3, @newwomen = 0, @repeatmen = 10, @repeatwomen = 3


SELECT @numerator1 = [n!] FROM [dbo].[Factorial] WHERE N = (@newmen+@newwomen)
--select @newmen+@newwomen
SELECT @numerator2 = [n!] FROM [dbo].[Factorial] WHERE N = (@repeatmen+@repeatwomen)
--select @repeatmen+@repeatwomen

SELECT @numerator3 = [n!] FROM [dbo].[Factorial] WHERE N = (@newmen+@repeatmen)
--select @newmen+@repeatwomen

SELECT @numerator4 = [n!] FROM [dbo].[Factorial] WHERE N = (@newwomen+@repeatwomen)
--select @newwomen+@repeatmen

--select @numerator1, @numerator2, @numerator3, @numerator4
SELECT @denominator1 = [n!] FROM [dbo].[Factorial] WHERE N = @newmen
SELECT @denominator2 = [n!] FROM [dbo].[Factorial] WHERE N = @newwomen
SELECT @denominator3 = [n!] FROM [dbo].[Factorial] WHERE N = @repeatmen
SELECT @denominator4 = [n!] FROM [dbo].[Factorial] WHERE N = @repeatwomen
SELECT @denominator5 = [n!] FROM [dbo].[Factorial] WHERE N = (@newmen+@newwomen+@repeatmen+@repeatwomen)
SELECT @pvalue = (@numerator1*@numerator2*@numerator3*@numerator4)/(@denominator1*@denominator2*@denominator3*@denominator4*@denominator5)
--select @denominator1, @denominator2, @denominator3, @denominator4, @denominator5
SELECT 'Matrix 3' as Matrix, @pvalue as PValue

SELECT @newmen = 0, @newwomen = 3, @repeatmen = 13, @repeatwomen = 0


SELECT @numerator1 = [n!] FROM [dbo].[Factorial] WHERE N = (@newmen+@newwomen)
--select @newmen+@newwomen
SELECT @numerator2 = [n!] FROM [dbo].[Factorial] WHERE N = (@repeatmen+@repeatwomen)
--select @repeatmen+@repeatwomen

SELECT @numerator3 = [n!] FROM [dbo].[Factorial] WHERE N = (@newmen+@repeatmen)
--select @newmen+@repeatwomen

SELECT @numerator4 = [n!] FROM [dbo].[Factorial] WHERE N = (@newwomen+@repeatwomen)
--select @newwomen+@repeatmen

--select @numerator1, @numerator2, @numerator3, @numerator4
SELECT @denominator1 = [n!] FROM [dbo].[Factorial] WHERE N = @newmen
SELECT @denominator2 = [n!] FROM [dbo].[Factorial] WHERE N = @newwomen
SELECT @denominator3 = [n!] FROM [dbo].[Factorial] WHERE N = @repeatmen
SELECT @denominator4 = [n!] FROM [dbo].[Factorial] WHERE N = @repeatwomen
SELECT @denominator5 = [n!] FROM [dbo].[Factorial] WHERE N = (@newmen+@newwomen+@repeatmen+@repeatwomen)
SELECT @pvalue = (@numerator1*@numerator2*@numerator3*@numerator4)/(@denominator1*@denominator2*@denominator3*@denominator4*@denominator5)
--select @denominator1, @denominator2, @denominator3, @denominator4, @denominator5
SELECT 'Matrix 4' as Matrix, @pvalue as PValue

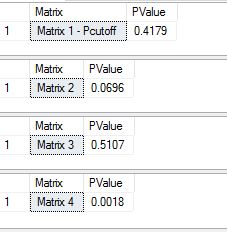
The response we get is as below.

fischers4

If we sum the 3 values that are less than base value 0.4179 – we get 0.4179 + 0.0696 + 0.0018 = 0.4893, which is exactly what we got from the R function.

Step 5: Conclusion: Since 0.4893 is greater than our desired value of 0.05, our decision rule did not pass. Or in other words, we accept the null hypothesis in Step 1, that there is no significant correlation between these two variables.

So, we can logically conclude, that based on the data we are given, we do not have enough evidence that gender of speakers and their count is actually related or significant. Thanks for reading!!


The Birthday Problem – with T-SQL and R

When I was on SQLCruise recently – Buck Woody (b|t) made a interesting statement – that in a room of 23 people, there is over a 50% chance that  two or more have the same birthdays. And sure enough, we did end up having more than two people with same birthday. I was tempted to play with this rather famous problem (there is a great introductory wiki post on it here)  using statistics for a while, and got around to it this weekend. Let us test the hypothesis first.

Given a room of 23 random people, what are chances that two or more of them have the same birthday? 

This problem is a little different from the earlier ones, where we actually knew what the probability in each situation was.

What are chances that two people do NOT share the same birthday? Let us exclude leap years for now..chances that two people do not share the same birthday is 364/365, since one person’s birthday is already a given. In a group of 23 people, there are 253 possible pairs (23*22)/2. So the chances of no two people sharing a birthday is 364/365 multiplied 253 times. The chances of two people sharing a birthday, then, per basics of probability, is 1 – this. Doing the math then – first with T-SQL –

DECLARE @x INTEGER, @NUMBEROFPAIRS INTEGER, @probability_notapair numeric(18, 4), @probability_pair numeric(18, 4)
DECLARE @daysinyear numeric(18,4), @daysinyearminus1 numeric(18, 4)
SELECT @x = 23
SELECT @numberofpairs = (@x*(@x-1)/2)
SELECT @daysinyear = 365
SELECT @daysinyearminus1 = @daysinyear - 1

SELECT @probability_notapair = (@daysinyearminus1/@daysinyear)

SELECT 'Probability of a pair having birthdays' ,1-power(@probability_notapair, @NUMBEROFPAIRS)

birthday

In R this is very easily calculated using the line

prod(1-(0:22)/365)

To be aware that prod is just a function that multiplies what it is supplied, it is not a special statistical function of any kind. In this case since the math is really easy, that is all we need to calculate the result.

bday

As we can see it is pretty close to what we got with T-SQL.

We can play around with R a little bit and get a nice graph illustrating the same thing.

positiveprob <- numeric(23) #creatingvectortoholdvalues
#loop and fill values in vector
for (n in 1:23) {
 negativeprob <- 1 - (0:(n - 1))/365
 positiveprob[n] <- 1 - prod(negativeprob) }
#draw graph to show probability
plot(positiveprob, main = 'Graph of birthday probabilites for 23 people', xlab = 'Number of people in room', ylab = 'Probability of same birthdays')

bday3

As we can see the probability of two or more people sharing a birthday in a room of about 23 is near 50%. Pretty amazing.

There is a ton of very detailed posts on this rather famous problem, this is just a basic intro for those of you learning stats and R.
1 https://www.scientificamerican.com/article/bring-science-home-probability-birthday-paradox/

2 http://blog.revolutionanalytics.com/2012/06/simulating-the-birthday-problem-with-data-derived-probabilities.html

Thanks for reading!!

Normal approximation to binomial distribution using T-SQL and R

In the previous post I demonstrated the use of binomial formula to calculate probabilities of events occurring in certain situations. In this post am going to explore the same situation with a bigger sample set. Let us assume, for example, that instead of 7 smokers we had 100 smokers. We want to know what are the chances that a maximum of 35 of them have a serious lung disease. Going by the Binomial formula illustrated in the previous post that would mean a whole lot of calculations – calculating the probability of every situation less than 35 and then stick the values into the formula to derive an answer. That is a very laborious way to derive a result, even if we are using an automated process to do it.  An easier way to do it is to use the normal distribution, or central limit theorem. My post on the theorem illustrates that a sample will follow normal distribution if the sample size is large enough. We will use that as well as the rules around determining probabilities in a normal distribution, to arrive at the probability in this case.
Problem: I have a group of 100 friends who are smokers.  The probability of a random smoker having lung disease is 0.3. What are chances that a maximum of 35 people wind up with lung disease?

Step 1: How do I know my problem fits this particular statistical solution?
To determine whether n is large enough to use what statisticians call the normal approximation to the binomial, both of the following conditions must hold:

image0.png

In this case 100*0.3 = 30, which is way greater than 10. The second condition 100*0.7 is also 70 and way greater than 10. So we are good to proceed.

2 Statistically stated, we need to find P(x<=35)

3 The formula to use now is zee where ‘meu’ in the numerator is the mean and sigma, the denominator is the standard deviation. Let us use some tried and trusted t-sql to arrive at this value.

4 We use 35 as x, but we add 0.5 as suggested ‘corrective value’ to it. Running T-SQL to get z value as below:

DECLARE @X numeric(10,4), @p numeric(10, 4), @n numeric
(10, 4), @Z NUMERIC(10, 4)
DECLARE @MEAN NUMERIC(10, 4), @VARIANCE NUMERIC(10, 4), @SD NUMERIC(10, 4)
SELECT @X = 35.5
SELECT @P = 0.3
SELECT @N = 100
SELECT @MEAN = @N*@p
SELECT @VARIANCE = @N*@p*(1-@p)
SELECT @SD = SQRT(@VARIANCE)
SELECT @Z = (@X-@MEAN)/@SD
SELECT @Z as 'Z value'

zvalue

5 To calculate probability from Z value, we can use Z value tables. There are also plenty of online calculators available – I used this one.  I get probability to be 0.884969.

zvalue

6 The same calculation can be achieved with great ease in R by just saying

pbinom(35,size=100,prob=0.3)

The result I get is very close to above.

zvalue

You can get the same result by calling the R function from within TSQL as below

EXEC sp_execute_external_script
 @language = N'R'
 ,@script = N'x<-pbinom(35,size=100,prob=0.3);
 print(x);'
 ,@input_data_1 = N'SELECT 1;'

zee

In other words, there is a 88.39 percent chance that 35 out of 100 smokers end up with lung disease. Thank you for reading!


The Binomial Formula with T-SQL and R

In a previous post I explained the basics of probability. In this post I will use some of those principles to see how to solve certain problems. I will pick a very simple problem that I found in a statistics textbook. Suppose I have 7 friends who are smokers. The probability that a random smoker will develop a lung condition is 0.3. What is the probability that a maximum of 2 of them will develop a severe lung condition? To apply the binomial formula for this problem – I need the following conditions to be met:

1 The trials are independent
2 The number of trials, n is fixed.
3 Each trial outcome can be a success or a failure
4 The probability of success in each case is the same.

Applying these rules –
1 The 7 smoking friends are not related or from the same group. (This is important as one friend’s habits can influence another and that does not make for an independent trial).
2 They smoke approximately at the same rate.
3 Either they get a lung disease or they don’t. We are not considering other issues they may have because of smoking.
4 Since all these conditions are met, the probability of each of them getting a lung disease is more or less the same.

The binomial formula given that
x = total number of “successes” (pass or fail, heads or tails etc.)
P = probability of a success on an individual trial
n = number of trials
q= 1 – p – is as below:

prob

For those not math savvy the ! stands for factorial of a number. In above example n equals 7. x, The number of ‘successes’ (morbid, i know, to define a lung condition as a success but just an example) we are looking for is 2. p is given to be 0. and q is 1 – 0.3 which is 0.7.  Now, given the rules of probability – we need to add probability of 0 or none having a lung condition, 1 person having a lung condition and 2 having a lung condition – to see what is the probability of a maximum of 2 having a lung condition. Let us look at doing this with T-SQL first, then with R and then calling the R script from within T-SQL.

1 Using T-SQL:

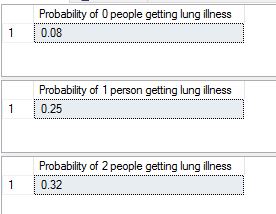
There are a lot of different ways to write the simple code of calculating factorial. I found this one to be most handy and reused it. I created the user defined function as ‘factorial’ and used the same code below to calculate probabilities of 0.1 or 2 people getting a lung illness. If we add the 3 together we get the total probability of the maximum of 2 people getting a lung illness – which is about 0.65 or 65 %.

DECLARE @n decimal(10,2), @x decimal(10, 2), @p decimal(10, 2), @q decimal(10, 2)
DECLARE @p0 decimal(10, 2), @p1 decimal(10, 2), @p2 decimal(10, 2), @n1 decimal(10, 2), @n2 decimal(10, 2), @n3 decimal(10, 2)
SELECT @n = 7, @x = 0, @p = 0.3,@q=0.7
SELECT @x = 0
SELECT @n1 = dbo.factorial(@n) 
SELECT @n2 = dbo.factorial(@n-@x)
SELECT @n3 = 1

SELECT @p1 = ( @n1/(@n2 * @n3))*power(@p, @x)*power(@q,@n-@x)
select @p1 as 'Probability of 0 people getting lung illness'

SELECT @x = 1
SELECT @p1 = ( @n/@x)*power(@p, @x)*power(@q,@n-@x)
select @p1 as 'Probability of 1 person getting lung illness'

SELECT @x = 2
SELECT @n1 = dbo.factorial(@n) 
SELECT @n2 = dbo.factorial(@n-@x)
SELECT @n3 = dbo.factorial(@x)
SELECT @p2 = ( @n1/(@n2 * @n3))*power(@p, @x)*power(@q,@n-@x)
select @p2 as 'Probability of 2 people getting lung illness'


Results are as below:

prob1

2 Using R:

The R function for this is seriously simple, one line call as below.

dbinom(0:2, size=7, prob=0.3)

My results, almost exactly the same as what we got with T-SQL.

prob2

3 Calling R from T-SQL:

Instead of writing all that code i can simply call this function from with TSQL –

EXEC sp_execute_external_script
 @language = N'R'
 ,@script = N'x<-dbinom(0:2, size=7, prob=0.3);
 print(x);'
 ,@input_data_1 = N'SELECT 1;'

Results as below:

prob3

It is a LOT of fun to get our numbers to tie in more than one way. Thanks for reading.


Sampling Distribution and Central Limit Theorem

In this post am going to explain (in highly simplified terms) two very important statistical concepts – the sampling distribution and central limit  theorem.

The sampling distribution is the distribution of means collected from random samples taken from a population. So, for example, if i have a population of life expectancies around the globe. I draw five different samples from it. For each sample set I calculate the mean. The collection of those means would make up my sample distribution. Generally, the mean of the sample distribution will equal the mean of the population, and the standard deviation of the sample distribution will equal the standard deviation of the population.

The central limit theorem states that the sampling distribution of the mean of any independent,random variable will be normal or nearly normal, if the sample size is large enough. How large is “large enough”? The answer depends on two factors.

  • Requirements for accuracy. The more closely the sampling distribution needs to resemble a normal distribution, the more sample points will be required.
  • The shape of the underlying population. The more closely the original population resembles a normal distribution, the fewer sample points will be required. (from stattrek.com).

The main use of the sampling distribution is to verify the accuracy of many statistics and population they were based upon.

Let me try demonstrating this with an example in TSQL. I am going to use [Production].[WorkOrder] table from Adventureworks2016. To begin with, am going to test if this data is actually a normal distribution in of itself. I use the Empirical rule test I have described here for this.  Running the code for the test, I get values that tell me that this data is very skewed and hence not a normal distribution.

DECLARE @sdev numeric(18,2), @mean numeric(18, 2), @sigma1 numeric(18, 2), @sigma2 numeric(18, 2), @sigma3 numeric(18, 2)
DECLARE @totalcount numeric(18, 2)
SELECT @sdev = SQRT(var(orderqty)) FROM [Production].[WorkOrder]
SELECT @mean = sum(orderqty)/count(*) FROM [Production].[WorkOrder]
SELECT @totalcount = count(*) FROM [Production].[WorkOrder] where orderqty > 0

SELECT @sigma1 = (count(*)/@totalcount)*100 FROM [Production].[WorkOrder] WHERE orderqty >= @mean-@sdev and orderqty<= @mean+@sdev
SELECT @sigma2 = (count(*)/@totalcount)*100 FROM [Production].[WorkOrder] WHERE orderqty >= @mean-(2*@sdev) and orderqty<= @mean+(2*@sdev)
SELECT @sigma3 = (count(*)/@totalcount)*100 FROM [Production].[WorkOrder] WHERE orderqty >= @mean-(3*@sdev) and orderqty<= @mean+(3*@sdev)

SELECT @sigma1 AS 'Percentage in one SD FROM mean', @sigma2 AS 'Percentage in two SD FROM mean', @sigma3 as 'Percentage in 3 SD FROM mean

In order for the data to be a normal distribution – the following conditions have to be met –

68% of data falls within the first standard deviation from the mean.
95% fall within two standard deviations.
99.7% fall within three standard deviations.

The results we get from above query suggest to us that the raw data does not quite align with these rules and hence is not a normal distribution.

pic1

Now, let us create a sampling distribution from this. To do this we need to pull a few random samples of the data. I used the query suggested here to pull random samples from tables. I pull 30 samples in all and put them into tables.

 SELECT * INTO [Production].[WorkOrderSample20]
 FROM [Production].[WorkOrder]
 WHERE (ABS(CAST((BINARY_CHECKSUM(*) * RAND()) as int)) % 100) < 20

I run this query 30 times and change the name of the table the results go into, so am now left with 30 tables with random samples of data from main table.

Now, I have to calculate the mean of each sample, pool it all together and then re run the test for normal distribution to see what we get. I do all of that below.

DECLARE @samplingdist TABLE (samplemean INT)
 
 INSERT INTO @samplingdist (samplemean)
 select sum(orderqty)/count(*) from [Production].[WorkOrderSample1]

 INSERT INTO @samplingdist (samplemean)
 select sum(orderqty)/count(*) from [Production].[WorkOrderSample2]
 
 INSERT INTO @samplingdist (samplemean)
 select sum(orderqty)/count(*) from [Production].[WorkOrderSample3]
 
 INSERT INTO @samplingdist (samplemean)
 select sum(orderqty)/count(*) from [Production].[WorkOrderSample4]

 INSERT INTO @samplingdist (samplemean)
 select sum(orderqty)/count(*) from [Production].[WorkOrderSample5]

 INSERT INTO @samplingdist (samplemean)
 select sum(orderqty)/count(*) from [Production].[WorkOrderSample6]

 INSERT INTO @samplingdist (samplemean)
 select sum(orderqty)/count(*) from [Production].[WorkOrderSample7]

 INSERT INTO @samplingdist (samplemean)
 select sum(orderqty)/count(*) from [Production].[WorkOrderSample8]

 INSERT INTO @samplingdist (samplemean)
 select sum(orderqty)/count(*) from [Production].[WorkOrderSample9]

 INSERT INTO @samplingdist (samplemean)
 select sum(orderqty)/count(*) from [Production].[WorkOrderSample10]

 INSERT INTO @samplingdist (samplemean)
 select sum(orderqty)/count(*) from [Production].[WorkOrderSample11]

 INSERT INTO @samplingdist (samplemean)
 select sum(orderqty)/count(*) from [Production].[WorkOrderSample12]

 INSERT INTO @samplingdist (samplemean)
 select sum(orderqty)/count(*) from [Production].[WorkOrderSample13]

 INSERT INTO @samplingdist (samplemean)
 select sum(orderqty)/count(*) from [Production].[WorkOrderSample14]

 INSERT INTO @samplingdist (samplemean)
 select sum(orderqty)/count(*) from [Production].[WorkOrderSample15]

 INSERT INTO @samplingdist (samplemean)
 select sum(orderqty)/count(*) from [Production].[WorkOrderSample16]

 INSERT INTO @samplingdist (samplemean)
 select sum(orderqty)/count(*) from [Production].[WorkOrderSample17]

 INSERT INTO @samplingdist (samplemean)
 select sum(orderqty)/count(*) from [Production].[WorkOrderSample18]

 INSERT INTO @samplingdist (samplemean)
 select sum(orderqty)/count(*) from [Production].[WorkOrderSample19]

 INSERT INTO @samplingdist (samplemean)
 select sum(orderqty)/count(*) from [Production].[WorkOrderSample20]

 INSERT INTO @samplingdist (samplemean)
 select sum(orderqty)/count(*) from [Production].[WorkOrderSample21]

 INSERT INTO @samplingdist (samplemean)
 select sum(orderqty)/count(*) from [Production].[WorkOrderSample22]

 INSERT INTO @samplingdist (samplemean)
 select sum(orderqty)/count(*) from [Production].[WorkOrderSample23]

 INSERT INTO @samplingdist (samplemean)
 select sum(orderqty)/count(*) from [Production].[WorkOrderSample24]

 INSERT INTO @samplingdist (samplemean)
 select sum(orderqty)/count(*) from [Production].[WorkOrderSample25]

 INSERT INTO @samplingdist (samplemean)
 select sum(orderqty)/count(*) from [Production].[WorkOrderSample26]

 INSERT INTO @samplingdist (samplemean)
 select sum(orderqty)/count(*) from [Production].[WorkOrderSample27]

 INSERT INTO @samplingdist (samplemean)
 select sum(orderqty)/count(*) from [Production].[WorkOrderSample28]

 INSERT INTO @samplingdist (samplemean)
 select sum(orderqty)/count(*) from [Production].[WorkOrderSample29]

 INSERT INTO @samplingdist (samplemean)
 select sum(orderqty)/count(*) from [Production].[WorkOrderSample30]


DECLARE @sdev numeric(18,2), @mean numeric(18, 2), @sigma1 numeric(18, 2), @sigma2 numeric(18, 2), @sigma3 numeric(18, 2)
DECLARE @totalcount numeric(18, 2)
SELECT @sdev = SQRT(var(samplemean)) FROM @samplingdist
SELECT @mean = sum(samplemean)/count(*) FROM @samplingdist
SELECT @totalcount = count(*) FROM @samplingdist
SELECT @sigma1 = (count(*)/@totalcount)*100 FROM @samplingdist WHERE samplemean >= @mean-@sdev and samplemean<= @mean+@sdev
SELECT @sigma2 = (count(*)/@totalcount)*100 FROM @samplingdist WHERE samplemean >= @mean-(2*@sdev) and samplemean<= @mean+(2*@sdev)
SELECT @sigma3 = (count(*)/@totalcount)*100 FROM @samplingdist WHERE samplemean >= @mean-(3*@sdev) and samplemean<= @mean+(3*@sdev)

SELECT @sigma1 AS 'Percentage in one SD FROM mean', @sigma2 AS 'Percentage in two SD FROM mean', 
@sigma3 as 'Percentage in 3 SD FROM mean'The results I get are as below.

pic2

The results seem to be close to what is needed for a normal distribution now.

(68% of data should fall within the first standard deviation from the mean.
95% should fall within two standard deviations.
99.7% should fall within three standard deviations.)

It is almost magical how easily the rule fits. To get this to work  I had to work on many different sampling sizes – to remember the rule says that it needs considerable number of samples to reflect a normal distribution. In the next post I will look into some examples of using R for demonstrating the same theorem. Thank you for reading.