Basics of Probability

In this post am going to introduce into some of the basic principles of probability – and use it in other posts going forward. Quite a number of people would have learned these things in high school math and then forgotten – I personally needed a refresher. These concepts are very useful if we can keep them fresh in mind while dealing with more advanced programming in R and data analysis.
Probability is an important statistical and mathematical concept to understand. In simple terms – probability refers to the chances of possible outcome of an event occurring within the domain of multiple outcomes. Probability is indicated by a whole number – with 0 meaning that the outcome has no chance of occurring and 1 meaning that the outcome is certain to happen. So it is mathematically represented as P(event) = (# of outcomes in event / total # of outcomes). In addition to understanding this simple thing, we will also look at a basic example of conditional probability and independent events.

Let us take an example to study this more in detail.
I am going to use the same  dataset that I used for normal distribution – life expectancy from WHO. My dataset has 5 fields – Country, Year, Gender, Age. Am going to answer some basic questions on probability with this dataset.

1 What is the probability that a random person selected is female?  It is the total # of female persons divided by all persons, which gives us 0.6. (am not putting out the code as this is just very basic stuff). Conversely, the ‘complement rule’ as it is called means the probabilty of someone being male is 0.4. This can be computed as 1 – 0.6 or total # of men /total in sample. Since being both male and female is not possible, these two events can be considered mutually exclusive.

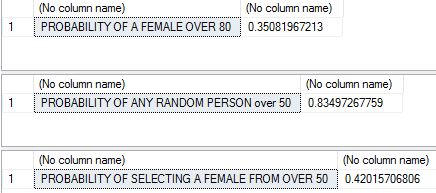
2 Let us look at some conditional probability. What is the probability that a female is selected given that you only have people over 50? The formula for this is probability of selecting a female over 50 divided by probability of selecting someone over 50.

DECLARE @COUNT NUMERIC(8, 2), @COUNTFEMALE NUMERIC(8, 2),@COUNTMALE NUMERIC(8, 2)
SELECT @COUNTFEMALE = COUNT(*) FROM [dbo].[WHO_LifeExpectancy] WHERE GENDER = 'female' and AGE > 50
SELECT @COUNT = COUNT(*) FROM [dbo].[WHO_LifeExpectancy]
SELECT 'PROBABILITY OF A FEMALE OVER 80' , @COUNTFEMALE/@COUNT
SELECT @COUNTMALE = COUNT(*) FROM [dbo].[WHO_LifeExpectancy] WHERE age > 50
SELECT @COUNT = COUNT(*) FROM [dbo].[WHO_LifeExpectancy]
SELECT 'PROBABILITY OF ANY RANDOM PERSON over 50' , @COUNTMALE/@COUNT
SELECT 'PROBABILITY OF SELECTING A FEMALE FROM OVER 50', @COUNTFEMALE/@COUNTMALE
PROBABILITY1

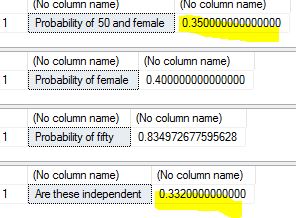
3 Do we know if these two events are dependent or independent of each other? That is , is does selecting a female over 50 affect the probability of selecting any person over 50? To find this out we have to apply the formula for independence – which is that the probability of their intersection should equal the product of their unconditional probabilities..that is probability of female over 50 multiplied by probability of female should equal probability of female and 50.

DECLARE @pro50andfemale numeric(12, 2), @total numeric(12, 2), @female numeric(12, 2), @fifty numeric(12, 2)
select @pro50andfemale= count(*) from [dbo].[WHO_LifeExpectancy] where age > 50 and gender = 'female'
select @total = count(*) from [dbo].[WHO_LifeExpectancy]
select 'Probability of 50 and female' ,round(@pro50andfemale/@total, 2)

select @female = count(*) from [dbo].[WHO_LifeExpectancy] where gender = 'female'
select 'Probability of female', @female/@total
select @fifty = count(*) from [dbo].[WHO_LifeExpectancy] where age > 50
select 'Probability of fifty', @fifty/@total
select 'Are these independent ', round((@female/@total), 2)*round((@fifty/@total), 2)

Results are as below..as we can see, the highlighted probability #s are very close suggesting that these two events are largely independent.
PROBABILITY1

From the next post am going to look into some of these concepts with R and do some real data analysis with them. Thanks for reading.


TSQL2sday – Daily database WTF

This month’s TSQL Tuesday is organized by Kennie T Pontoppidan(t) – the topic is ‘Daily Database WTF‘ – or a horror story from the database world.  As someone who has worked databases for nearly two decades, there are several of these – I picked one of my favorites. During my early years as a DBA, I was doing some contracting work for a government agency. At one of these agencies I encountered a rather strange problem. Their nightly backup job was failing on a daily basis. The lady DBA in charge was very stressed trying to solve it. It was a TSQL script written by someone who was no longer with them. According to their process, every failure had to be extensively documented on paper and filed for supervisors to review. So she had a file on this particular job failure that was bigger than the yellow pages, on her desk .She tasked me with finding out the reason for this job failure, as my first assignment.
I dug into the script – it was simple – it pulled an alphabetical list of databases from system metadata and proceeded to back them up. It didn’t do this one simple thing – leave TEMPDB off the list. So when the backups got down to TEMPDB, they promptly failed. Now as a smart person – I should have just communicated this to her and had it fixed quietly. But, I was young and rather hot headed at that time. It amazed me that a DBA with several years of experience did not know that TEMPDB cannot be backed up. So, I waited until the team meeting the next day. And when the said job failure came up again – I said that I knew the reason and stated why. I also added that this was a ‘very basic  thing’ that junior DBAs are supposed to know. I was stopped right there. It did not go down well. Her face was flaming red because a consultant showed her up in front of her boss in a bad light. She said she would talk to her boss and collegues the next day (several of whom were nodding their heads disapprovingly at me) and meeting was abruptly adjourned.
On my way back, I heard several people whisper that she does not like or do dissent, and I did a very unwise thing by pointing out something against her in public. I told myself that working with such a person would not be the right thing for me. When I came in to the office the next day, the HR girl was waiting at my desk. I was escorted to her office and told that my behavior was not acceptable coming from a consultant, and that my contract was terminated. I still recall being walked to the door with my jaw half open. Before she shut the door on me I said ‘there are still issues with that script, if you want to know’. Well sure enough they didn’t, and I went home. I really, honestly felt amused and free, despite the fact that I had no job to pay my bills.
In another week’s time, I had found another gig and moved on. I heard later about the issue I had not talked about. The databases that lined up after TEMPDB alphabetically were never backed up. In months. They had had a massive system failure and found out that they had no backups to recover from it. I don’t know if the lady in charge or her friends suffered any consequences, it was a government job after all and they could not be easily fired. But I do know that they found out the hard way and somebody probably paid for it.
I always narrate this incredible story to people who get fired for things that they did right, and also to watch your back in politically sensitive situations.

Generating Frequency Table

This week’s blog post is rather simple. One of the main characteristics of a data set involving classes, or discrete variables – are frequencies. The number of times each data element or class is observed is called its frequency. A table that displays the discrete variable and number of times it occurs in the data set is called a ‘Frequency Table’.A frequency table usually has frequency, percent or relative frequency expressed in % (the percentage of occurrences), cumulative frequency – the number of times all the preceding values have occurred and Cumulative Relative Frequency which is the ratio of cumulative frequency to size of sample (this can also be expressed as a percent if so desired).

For creating this I used the same data set I used for studying Simpson’s Paradox
To remember that variables we are deriving frequency for should be DISCRETE  in nature and each instance of the variable should be related/comparable to another in some way. If we are interested in cumulative values – those should make some kind of sense..so just summing all records before a name, or before a product(even though those classify as discrete), may not really make sense in most situations .In this case my variable is the age cohort, so summing whatever is below a certain age cohort can be useful data.

My TSQL for this is as below:

DECLARE @totalcount numeric(18, 2)
SELECT @totalcount = COUNT(*) FROM [dbo].[paradox_data]
;WITH agecte AS 
(
 SELECT [agecohort], c = COUNT(agecohort) 
 FROM [dbo].[paradox_data]
 GROUP BY [AgeCohort] 
)
SELECT agecte.[agecohort], c as frequency,(agecte.c/@totalcount)*100 AS [percent], 
 cumulativefrequency = SUM(c) OVER (ORDER BY [agecohort] ROWS UNBOUNDED PRECEDING),
 cumulativepercent = ((SUM(c) OVER (ORDER BY [agecohort] ROWS UNBOUNDED PRECEDING))/@totalcount)*100
FROM agecte
ORDER BY agecte.[agecohort];

My results are as below. I have 1000 records in the table. This tells me that I have 82 occurences of age cohort 0-5, 8.2% of my dataset is from this bracket, 82 again is the cumulative frequency since this is the first record and 8.2 cumulative percent. For the next bracket 06-12 I have 175 occurences, 17.5 %, 257 occurences of age below 12, and 25.7 % of my data is in this age bracket. And so on.

freq1

Let us try the same thing with R. As it is with most R code, part of this is already written in a neat little function here. I did however, find some issues with this code and had to modify it. The main issue was that the function was calculating ‘length’ of the dataframe (in sql terms – number of records) from the variable – and R kept returning a value of ‘1’. The correct way to calculate number of records is to specify the field name after the dataframe, so when I did that it was able to get to the total number of records. This is a little nuance/trick with R that gets many sql people confused, and was happy to have figured it out. I do not know of a ‘macro’ or a generalised function that can pull this value so I had to stick it to the function. It will be different if you use another field for sure. The modified function and value it returns is as below.

##This is my code to initiate R and bring in the dataset

install.packages("RODBC")
library(RODBC)

cn <- odbcDriverConnect(connection="Driver={SQL Server Native Client 11.0};server=MALATH-PC\\SQL01;database=paradox_data;Uid=sa;Pwd=mypwd")data <- sqlQuery(cn, 'select agecohort from [dbo].[paradox_data]')

make_freq_table <- function( lcl_list )


 {
 ## This function will create a frequency table for 
 ## the one variable sent to it where that 
 ## table gives the items, the frequency, the relative 
 ## frequeny, the cumulative frequency, the relative
 ## cumulative frequency
 ## The actual result of this function is a data frame 
 ## holding that table.
 lcl_freq <- table( lcl_list )
 

##had to change this from original code to pull correct length.

lcl_size <- length( lcl_list$agecohort )
 lcl_df <- data.frame( lcl_freq )
 names( lcl_df ) <- c("Items","Freq")
 lcl_values <- as.numeric( lcl_freq )
 lcl_df$rel_freq_percent <- (lcl_values / lcl_size)*100
 lcl_df$cumul_freq <- cumsum( lcl_values )
 lcl_df$rel_cumul_freq_percent <- (cumsum( lcl_values ) / lcl_size)*100
lcl_df
 } 

make_freq_table(data) 


The result I get is as below and is the same as what I got with T-SQL.

freq2

Since this is a rather simple example that is 100 percent do-able in TSQL – I did not find the need to do it by calling R from within it. It did help me learn some nuances about R though.

Thanks for reading.