Box-and-whisker plot and data patterns with R and T-SQL

R is particularly good with drawing graphs with data. Some graphs are familiar to most DBAs as it has been things we have seen and used over time – bar charts, pie diagram and so on. Some are not. Understanding exploratory graphics is vitally important to the R programmer/data science newbie. This week I wanted to share what I learned about the box-and-whisker plot, a commonly used graph in R – and one that greatly helps to understand and interpret spread of data. Before getting into specifics of how data is described with this plot, we need to understand a term called Interquartile Range. For each range or subset of data we are involved with (or rather the field we choose to ‘group by’), the middle value is called ‘Median’. The middle of the top 50% of values is called first quartile, and middle of the bottom 50% is called ‘second quartile’. Difference between first and second quartile is called ‘interquartile range’. A box-and-whisker plot helps us to see these values visually – and in addition to this also shows outliers in the data. To borrow a graphic from here – it is as below.
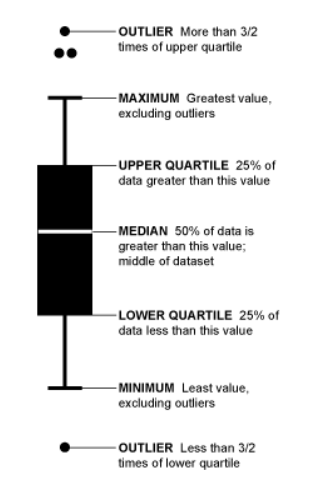
inqr

Now, let us look at the dataset on chicken weights in R with the help of this type of graphic.This is basically a dataset comprising of data on 71 randomly picked chickens, who were fed six different types of feed. Their weight was then observed and compiled. Let us say we sort this data from minimum to maximum weight for each feed.

You need the mosaic R package installed, which in turn has a few dependencies – dplyr, mosaicData,ggdendro and  ggformula. You can install each of these packages with the command install.packages(“<package name”, repos = http://mran.revolutionanalytics.com&#8221;) and then issue below command for pulling up with B-W plot.

library("mosaic")
bwplot(weight~feed, data=chickwts, xlab="Feed type", ylab="Chickem weight at six weeks (g)")

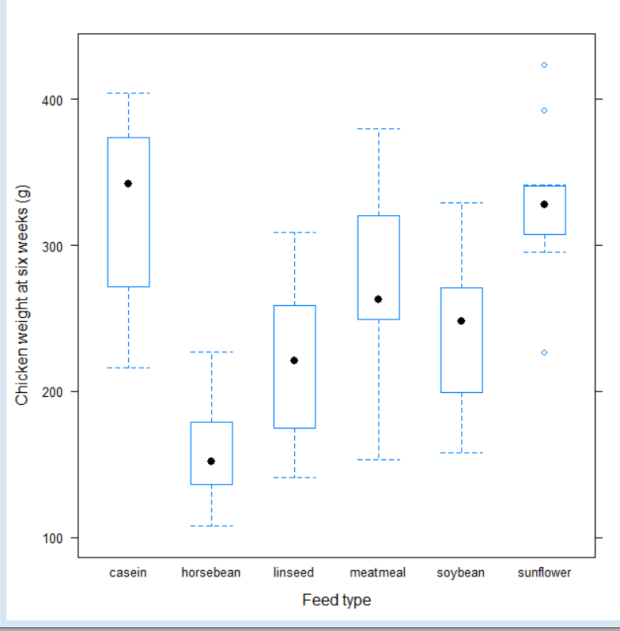
Results are as below:
chickfeed

With this we are easily able to see that
1 Feed type casein produces chickens with maximum weight
2 Feed type horsebean produces chickens with minimum weight
3 Feedtype sunflower has some outliers which don’t seem to match general pattern of data
4 The distribution of weights within each feed type seem fairly symetric.
5 There are also many overlapping weights across feed types.

To get to some of the numbers accurately you can just say

favstats(weight~feed, data=chickwts)

rstats

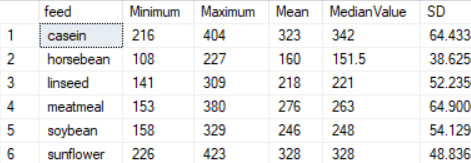
If you wish to get some of these values in T-SQL (i imported this data into SQL server via excel) – you can use query below. Comparing the values visually with graph will show that they are similar.

SELECT DISTINCT ck.feed,MIN(weight) OVER (PARTITION BY ck.feed) AS Minimum, Max(weight) OVER (PARTITION BY ck.feed) AS Maximum, 
AVG(weight) OVER (PARTITION BY ck.feed) AS Mean,
PERCENTILE_CONT(0.5) WITHIN GROUP (ORDER BY ck.weight)OVER (PARTITION BY ck.feed) AS MedianValue,
STDEV(weight) OVER (PARTITION BY ck.feed) AS SD
FROM chickfeed ck ORDER BY feed;

Results are as below:

sql

The math for Q1 and Q3 are a little complicated in T-SQL, I was unsure if it was worth doing since that is not the point of my blog post. You can find info on it here

As we can see, the numbers tie up regardless of which way we do it. But it is much harder though to find patterns and outliers using code. The graph is undoubtedly more useful in this regard.

In the next post we will look into applying some analysis of variance (ANOVA) to examine if the difference in weights across feed types is really significant to arrive at any conclusion on nature of the feed. Thanks for reading!
 

Confidence Intervals for a proportion – using R

What is the difference between reading numbers as they are presented, and interpreting them in a mature, deeper way? One way perhaps to look at the latter is what statisticians call ‘confidence interval’.

Suppose I look at a sampling of 100 americans who are asked if they approve of the job the supreme court is doing. Let us say for simplicity’s sake that the only two answers possible are yes or no. Out of 100, say 40% say yes. As an ordinary person, you would think 40% of people just approve. But a deeper answer would be – the true proportion of americans who approve of the job the supreme court is doing is between x% and y%.

How confident I am that it is?  About z%. (the common math used is 95%).  That is an answer that is more reflective of the uncertainty related to questioning people and taking the answers to be what is truly reflective of an opinion. The x and y values make up what is called a ‘confidence interval’.

Let us illustrate this with an example.

From this article  – out of a random sampling of 1089 people, 41% approved of the job the supreme court was doing. To construct the confidence interval, the first step is to determine if this sampling satisfies the needs for a normal distribution.
Step 1: Is the data from a normal distribution?
When we do not have the entire dataset with us, we use the below two rules to determine this:
1 The sample observations are independent – from the article it seems like random people were selected so this is safe to assume.
2 We need a minimum of 10 successes and 10 failures in the sample. – ie np >=10 and n(1-p) >= 10. This is called ‘success failure condition‘. Our n here is 1089, and p is 0.41. So successes are 1089*41 = 446.49 and failures are 642.5. Both are larger than 10, so we are good.
Step 2: Calculate standard error  or standard deviation of the confidence interval is calculated as square root of p(1-p)/n. In this case it is square root of 0.41*0.59/1089 which is 0.0149.
Step 3: Find the right critical value to use – we want a 95% confidence in our estimates, so the critical value recommended for this is 1.96.
Step 4: Calculate confidence interval – Now we have all we need to calculate confidence interval. The formula to use is point estimate +- (critical value x standard error) which is 0.41 + (1.96*0.0149)  = 0.4392, and 0.41 – (1.96*0.0149) = 0.3807.
So, we can say with 95% confidence that the true proportion of americans who approve of the supreme court is between 38.07% and 43.92%.

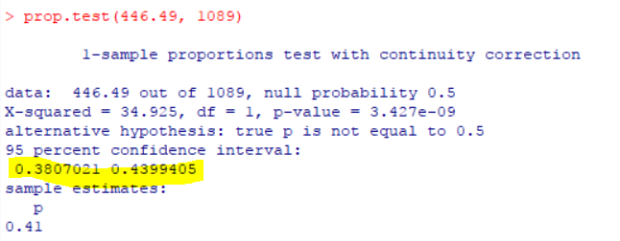
We can spare ourselves all this trouble by using a simple function in R as below, and we get the same results. We need to pass to this function what is 41% of 1089, which is 446.49.

Just typing prop.test(446.49, 1089) gets answers as below:

pic

So, with just two figures – the sample count and percentage value, we were able to derive a deeper conclusion of what this data might mean. Thanks for reading!


What is networking, really?

I am still trying to get up to speed on blogging after a gap. Today I managed to push myself to write some R code and test it, and it worked. Am getting there, although need more work to turn it into a blog post. So, here is another on the lines of professional development. It is about that word that many people hear of and know of, but really don’t know exactly what it means. I certainly didn’t.
When I was new to the community, I heard many people say networking is the best way to find work. But I really didn’t know what they meant. I thought you had to know a lot of very influential people, and am not the kind of person to seek out people of power/importance and push my cause with them. After a few years, that definition changed. Now I thought I need to tell people am looking for work and they would in turn respond if they knew of an opportunity that was of interest. This is true, but true only partially. It rarely happened. I started telling people I was looking for work, and almost nobody sent me any contacts or information. I was hurt and disappointed when they didn’t. Many times I started considering if it was worth my time to go to conferences/sql saturdays and so on.  It took me close to 15 years to figure out what networking really is, and to get it work for me (at times, it doesn’t work all the time, nothing really works all the time 🙂

To me it is as below:

1 Networking is really just making friends. Get friendly, learn to relax, introduce yourself to new people. Don’t go with any heavy objective or intent. Say you are so-and-so, pleased to meet you and then see how it goes. The next time you see that person, he/she may recall who you are. And there maybe someone else with them that they may introduce to you. That is how the friends circle/network grows.
2 Talk of things you are comfortable talking about. There are many things people talk of that one cannot participate in because one does not share that common interest or simply one does not like it. To me specific topics like that include religion, politics and at times cultural differences. I stick to things am comfortable with and usually find things to talk of in that area.
3 Make your work known via blog posts, talking at user groups or other events. This is by far the most important key to people recommending you for jobs or even letting you know of open positions. If they don’t know what you are good at they can’t relate you to any position you’d be good at. That is partly why I personally didn’t get anyone to recommend me, and I never realized it. Once I got active with blogging and speaking, things changed rather dramatically.
4 Give things time. Networking and building your network takes a long time. Sometimes we can find instant chemistry/connections in people, and the person you talk to today may be your boss or colleague at the next job. But such miracles are rare. Most of the time, people take time to know you and over time that can mature into an opportunity, or a referral.
5 Get active on social media. Many of the friends I have in the sql community are people I got to know better via twitter. I am personally not hugely active myself, but I do read what they have to say and respond appropriately when I can. I also share what I blog and get comments or feedback on that from time to time. Twitter is by far the easiest media there is to make new friends, particularly in the sql community.  It is not as personal as facebook and not as opaque as linked in – it is somewhere in between and is easy to use.

I hope this helps anyone getting started newly with community and networking. Networking is worth it – not only will you gain a lot of support and friends, you will find job openings and opportunities that never existed, guides/mentors who can help you and friendships that can last a lifetime! Best of luck!!


14 years of Summit…

I have been trying to get my blogging going again after a gap of two months. It has been incredibly hard. To warm up, I decided to try some non technical posts. One of them is stuff I have been wanting to write a long time – with this year I will complete attending 14 years of PASS Summit. It has been a while. There are people who have attended every single summit – I am by no means the record holder for that. But attending the same conference and being part of the same community for 14 years is still something to be proud of, and am very proud of it.

For the first 3 years  – I could not afford the entire summit. I was a junior DBA cum programmer back then, on a work visa, making about 65K or so per year. Money was hard, and the summit wasn’t cheap. For my very first summit at chicago, I could only afford to pay my way for one day. (I think it was 300 to 400 dollars). The hotels close to the summit were expensive, so I took a Greyhound bus from Louisville. (I do not like to drive long distance on my own , and nobody I knew was going). I landed in Chicago early morning, attended a day’s class and took the bus back same day evening. Most of what was said during the day went above my head. All I did with SQL server back then was backups, restores, attaching and detaching databases, and creating a few DTS jobs. But, I saw many passionate people. I was inspired by their love of what they do, and wanted to be part of them. So, whether I learned anything or not, didn’t matter much. I wanted to come back here, to this community, although I didn’t know a single soul among them. I did this for 2 more years.
The year 2005 was at Grapevine, TX. I had received a modest bonus at work – could afford airfare and two days of hotel. So off I went again, to hang among these very excited strangers and try to understand a wee bit of what they were saying, or doing. During lunch break – I was wandering around and stopped at a table with a bald man and another lady. They seemed very friendly. The bald man was Rushabh Mehta, one of the board members at PASS. He asked me if I had a user group at Louisville. I said no, and he asked me if I was interested in starting one. I was mostly an introverted person. I did not know how to get word around or how to get people to attend a user group, even if I started one. I expressed these concerns. He reassured me that he would help with mailings and would also get the local Microsoft people to help. What he said next made my heart leap – they offered free attendance to entire conference for running a user group!! I decided to go for it. On my way back from TX – I knew one person now. I had Rushabh’s contact information. While sitting at the airport terminal waiting for my flight home – I saw another lady with a PASS backpack. I asked her if she was from Louisville – and she responded , yes. It was just two of us from our little town at the conference.  I explained what Rushabh had told me, and asked her if she would help me start up the first meeting for our user group. She was interested. Teresa Mills was the second person in the SQL community whom I got to know, via attending a PASS conference.
The first meeting of Louisville SQL Server user group started in 2006, at the local library, with 12 people in attendance. Some of those folks are still with me as volunteers for SQL Saturday and for the chapter. After that, I started going to the summit every year. Some years, I got my employer to pay the whole way. Some other years, I had to pay for hotel. Or the airfare. In some rare cases, I had to take paid time off to go. I also volunteered for PASS in every capacity I could – I wrote for their newsletter, mentored new attendees, served on selection committee, worked as a Tech Ed volunteer, moderated 24HoP – everything I could in the time I had.
Now, after 15 years, I know a LOT of people in the community. It is many times difficult to find time for all of them. I have never had to look for work the traditional way – all my jobs after I started the user group have been because of referrals  – people I know in community telling others that am good at what I do.  Last year I was awarded the PASSion award for best volunteer – the highest recognition a volunteer can get. I am sure glad to have boarded the Greyhound bus that night into a city and among people I never knew or understood. I hope you find it in you to take that find step. You never know where it will take you.