11 years of PASS Summit

This is a story of my 11-year association with PASS, and the many ways it helped me grow as a person and in my career. And the many ways I saw other people grow.

 Summit #1 – 2006: Gaylord,TX: I was a visa holding dba-developer at a small shop. The Microsoft marketing person who came to meet my boss sent me some info on the summit when I asked him for info on SQL Server related training. I could only afford two days along with paying for lodging and airfare. The resort was lovely. I did not know anyone in the crowd.Most of what was discussed was going above my head as a small-shop dba. In the vendor area I met a bald guy named Rushabh Mehta who was handing out fliers about starting user groups. I found out from him that there was no user group in Louisville. He encouraged me to start one, and readily gave me his cell number if I had any questions. On my way back home I met a lady at the airport who was from my town and worked as a DBA.She and I struck up a conversation and she was willing to help me with starting the user group.Our first user group meeting was at the local library attended by 12 people. Rushabh was the first person in the SQL community that I got to be friends with. Through the year he responded patiently to my many phone calls regarding setting up the site, getting speakers, getting sponsors, on and on.

Summit #2 – Denver, CO: By now the user group was going strong and I had gotten to know many people in the community as a result of running it. Craig Utley, Dave Fackler and Sarah Barela were among my first speakers. I got permission from work to spend a whole week at the summit – and since the registration was now comp-ed as a chapter lead I could afford to. At the Denver summit my best memory is around sitting at the breakfast table with a tall guy from Chicago named Brent Ozar who said he was an aspiring speaker.  I enjoyed the summit greatly and learned many new things.

Summit #3 – Seattle, WA: This was my first ‘proper’ summit – as this was the year they started doing chapter leader meetings. I still did not know too many people. Rushabh and another volunteer named Sujata from Rhode Island were the only people I knew. But I met many people at the chapter leader meeting and liked the discussions a lot. My earliest memories are around meeting TJ Belt and Troy Schuh. I also got a chance to meet Kevin Kline and Andy Warren. Andy talked to me about this day long event called SQL Saturdays that he was doing in Orlando. He readily offered me his cell number and help with setting up one in our town. Kevin offered to drive in from Nashville to speak for our user group. What impressed me right away was how sincere and committed they were to the cause.SQL Saturday #1 at Louisville started this year, with Andy’s coaching and at a small venue in New Horizons Louisville. Although we only had 50-60 attendees – it was a huge success and appreciated by many. We also had the honor of being sponsored by another user group – John Magnabosco from IndyPASS was our first sponsor. Don’t think there are too many sql saturdays who have been helped in this manner.

Summit #5 – Seattle, WA: By now I had started doing other things besides being a chapter lead and running a SQL Saturday – I wrote regularly for their news letter. I was a Regional Mentor for the South Asia region – and this year I also helped run the pass booth at Tech Ed. The summit had a table per chapter at lunch – it was at this table that I met a gentleman who would open doors for my next job soon after I got home. Two days after I was home – I received a phone call with a message from a large firm with a great reputation – that the DBA manager wanted to talk to me. Someone on his team was at the summit and had met me there, and had recommended me for a senior role based on our conversation. I could hardly believe my ears. I am not a naturally extroverted person. It is even harder for me to drum up my skills when needed. And in this case all that I did was to have a conversation with somebody at the lunch table. I met the person who called me and in a week I landed the best job of my career as a senior DBA. They also included in the contract that they would pay every dime of my expenses to the summit.

Summit #6, 7, 8, 9, 10 and this year…11 – time flies in a blur. I have done so many activities with PASS during these years – served on selection committee, moderated 24HOP, been first time attendee mentor..in fact I even forget some of those titles now as so much time has gone by. We have 10 years of SQL Saturdays to our credit now.  I intentionally book my room a little further from the summit for quiet time after the day, I can barely walk 10 steps without someone calling my name. I have never, ever, ever looked for jobs using headhunters or monster or dice or any such thing. after that one incident when I received a phone call. It has always been via referrals through the community. I think that is what I’d  consider the best reward ever professionally – that jobs come to you, you don’t go searching for them. And the friendships and relationships I’ve made via this community really don’t have a price tag. They have all grown along with me, as family – we will grow old together, retire and recall many of these good times.

Thank you SQLPASS, and #SQLFAMILY.


Why SQL Cruise?

I was riding the elevator up from lunch today, at work. I am relatively new at my job and do not know several people at my workplace – yet. I live in a small town, and quite a lot of them know me as someone active in the local community. I am very used to strangers asking me SQL – community related questions at places like Trader Joes, DMV, airport and all sorts of different places. Today – there was a young lady riding up with me. I knew her to be from the same workplace but not too well so we exchanged polite smiles and I looked down at my shoes, as I do always when am in the elevator with someone I barely know 🙂  When I got off she asked rather hesitantly – ‘excuse me, can I ask you something? Do you know much about what they call SQL Cruise?’..Needless to say , I was delighted. SQL cruise is one of my utter favorite topic of conversations, even with total strangers. For the next 10 minutes or so – she and I had a great conversation – I told her all about the cruise, about the places we’ve been to, the fun activities on board and on shore, the great training, office hours, everything. Most importantly what I told her was this –

I am 11 year regular attendee of the PASS summit.  Whenever anyone mentions a conference regarding SQL server – the summit is what comes to my mind atleast, to recommend. I love the PASS community and try to promote it whenever and wherever I can. But, there are things I don’t get at the summit.  One of them is about having time and leisure to grow good bonds  and getting to know people better. Make no mistake – 11 years of the summit have yielded me many, many friends for which am wholly grateful for. But not everyone can keep going that long, and not everyone has the same social skills to make friends from among 3000 + people. The summit is a huge gathering, and there are way too many distractions or things that get in the way of really hanging out even with people you know. I’ve lost count of times when just the noise and the crowd gets to me and I am left with a sort of a dazed look by thursday evening. By Friday I want to go home and all other thoughts are pretty much gone. I am wiped and need to recharge. I have decided, in the past 3 years – that the summit is a week to touchbase with people I know, and to attend some sessions on topics I don’t know and want to know. It does not work for me as a place to grow close friendships or even to network very well.

That is where  SQL Cruise comes in. When you meet, eat and spend time with people and their families – a bond develops. People get interested in you as a person, and you in turn are interested in them.A friendship is born and that can lead to many amazing possibilities – including job offers.And, to a die hard traveller like me – the amazing places I get to see are in themselves worth every dime. I get to see them with friends, people I really respect and have regard for. I cannot think of the gorgeous beaches of St Thomas, or the picture perfect Amalfi Coast, the grandeur of the Colosseum in Rome , the food at Barcelona, or the sights of Mendenhall Glacier – without thinking of them at the same time. And that kind of memories are simply not  created at any other conference or training.

So, if you’ve been reading my post so far – and if your goals are the same as mine – to see fun places, learn good SQL from among the best teachers, have discussions to the background of waves rocking a boat, make some good friends who are genuinely interested in your career and your success – sign up now! You will not regret it, I promise – and will come back for more.

Associative Statistics – One sample T-Test with TSQL and R

In this post am going to attempt to explore a statistical procedure called ‘One Sample T Test’.

A T-Test is used to test the mean value of a data sample against a known mean of the entire population from where the sample came from. An example would be, if the average voting preference of the USA is Democrat, I want to test the average voting preference in KY to see if that corresponds to the national average. Another simpler example is if all coke bottles produced are 150 ml on an average – I want to see if this quantity is exactly true (on an average) of the 10 coke bottles I have in the fridge.

For this post I decided to go with a simple example of how many steps I walked with my per day for the month of August. My goal is 10,000 steps per day – that has been my average over the year but is this true of the data I gathered in August? I have a simple table with two columns – day and steps. Each record has how many steps I took in August per day, for 30 days. So – SELECT AVG(steps) FROM [dbo].[mala-steps] gives me 8262 as my average number of steps per day in August. I want to know if am consistently under performing my goal, or if this is a result of my being less active in August alone. Let me state my problem first – or state what is called ‘null hypothesis’:

I walk 10,000 steps on an average per year. 

How is T value calculated? The formula for T value is a bit complex –

tvalue

The numerator x bar is the mean of the sample. The mew-zero as it is spelled is the hypothesised mean – or what I say I expect of the sample value – in my case , 10,000 steps.. The denominator – s, is the standard deviation of the sample or the square root of sum of difference between mean and each value, and n refers to sample size. Without pulling hair out on what this stands for etc – what it really means is the ratio of differences between sample values to the mean compared to ‘inner noise’, or the difference within the sample set itself. If you get a high value it means the sample set is probably not fitting my hypothesis, or there are too many differences between values and the hypothesised mean. A low value means the opposite, that the differences are internal to the sample.

My goal is to prove or disprove this with the sample selected from August. I am using a significance level of 0.01 or what is called 99% confidence level.

Using TSQL:

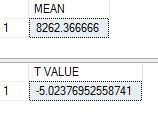
SELECT AVG(steps) AS 'MEAN' FROM [dbo].[mala-steps]
SELECT (AVG(STEPS)-10000)/(SQRT(VAR(STEPS))/SQRT(COUNT(*))) AS 'T VALUE' 
FROM [dbo].[mala-steps]

tsqltvalue

We get a mean of 8262.36 and a T value of -5.023.

Calculating the p value or probability for this T value can be done via calculator here – unfortunately this is not possible with TSQL. If we stick in the values of 5.023 and 29 degrees of freedom (30 values – 1) we get a really low p value

R does the entire math for us in one simple step as below:

install.packages("RODBC")
library(RODBC)
datasteps <- sqlQuery(cn, 'SELECT steps FROM [dbo].[mala-steps]') 
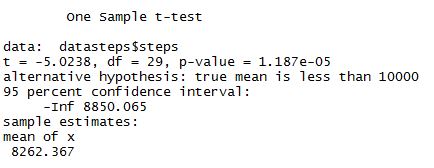
t.test(datasteps$steps, mu=10000, alternative="less", conf.level=0.95)

rttest

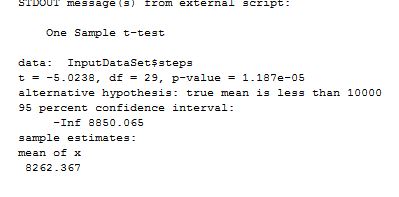
The same R code can be called from within TSQL too – giving results as below:

-- calculate one way T value
EXEC sp_execute_external_script
 @language = N'R'
 ,@script = N' tvalue <-t.test(InputDataSet$steps, mu=10000, alternative="less", conf.level=0.95);
 print(tvalue)'
 ,@input_data_1 = N'SELECT steps FROM [dbo].[mala-steps];'

rtsql-tvalue

From the output, we can see that the mean number of steps I have taken for the month of August is 8262. The t value is 5.02 (the sign does not matter). Which means that difference between individual values and the mean is higher than the ‘inner noise’ or the difference between values in the sample sample set.

The p-value ,or the probability of getting this t value from this sample is really really low –  1.187e-05.So, it is more likely this dataset/sample is probably not a good one – or in other words, i can’t accept the null hypothesis that I did walk an average of 10,000 steps a day based on this sample. Maybe August was not the best month to judge my commitment to exercise…or maybe i’d have to try more samples than August alone! More on those in next post!


Budgeting for SQL Saturdays

We’ve been doing SQLSaturdays for eight years at Louisville now. We’ve had a quite a wide range of budgets depending on the year – a good year (our highest was 2013) and lowest, the first year we started, 2009.

As main organizer, handling the dollars and making sure I spend them right has been an interesting, learning experience for me. For the past two years I’ve had additional help from others on the organizing committee, but for a good six years it was just me doing it and figuring out the do’s and don’ts the hard way. Below is how I do it now, and I have got it down to a good formula that works most of the time.

I divide the revenue into two buckets: – 1 Predictable and 2 Non- predictable. Predictable revenue is what comes in two months before the event. That includes committed sponsors. So far, we have been lucky in getting two or more this way. Non- predictable revenue is what comes in closer to the event, includes last- minute sponsors and revenue based on pre-cons.

Expenses wise – I divide my expenses into the following three buckets.

1. Essentials – These – include event rental, event insurance, and food. Without these,we cannot run.the event. The predictable sponsor revenue goes towards this category of expenses.

2. Wants – After we pass survival, the second bucket of expenses comes in: – that includes speaker dinner, speaker gifts,volunteer shirts; printing of various event- related material like internal signage , event schedule, speaker and event feedback forms; speedpass for speakers;lanyards and nametags. Printing of materials does not cost much. Volunteer-shirts is something we do every year as they are popular not expensive either. The main costs here are speaker dinner and speaker gifts – how much is spent on them depends strongly on how well we are funded.

3. Nice-to- haves – This includes attendee swag/give aways,extra treats to eat (such as cake or ice cream), and reusable event inventory that we can store for future events. We have done lots of cool things in this category – especially with reusable stuff. Our stock includes signage (external to the building), extension cords, foldable garbage bins, raffle boxes, dollies, a laser printer and many smaller items like paper, duct tape, staplers, scissors, and so on. We have enough stuff to just walk in somewhere and set up any event at short notice.

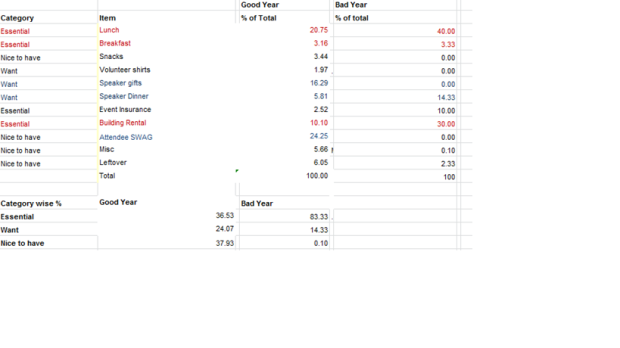
So that said, what about some real numbers? Below is the percentage breakup I have for a good event (where we have had great funding), and a low- funded event.

budgets

It is interesting to see that essentials take up 80% of funding on a typical bad year. Needless to say that nice-to-have-es are are almost down to zero. The question this type of analysis helps me answer is:

What is the minimum $ needed to put up an event?

Every SQL Saturday organizer should absolutely know the answer to this, if not you are walking blind. To know it you have to focus on what are the costs of essentials – room rental and food Remember that both costs are driven by attendee count. For us in Louisville – it is seriously hard to find a free location any more. We don’t like to cut down on attendees as we have worked hard to build up that  number and do not like disappointing them. I realize that there are events that can play with this number and reduce the number of attendees to support their funds, but I’d not like to do that unless am absolutely forced to. Finding a free location is also possible with smaller attendee counts, so that is not something to be ruled out entirely, but we’d like to keep that up as much as we can. With attendee count at 200-250, – the other numbers I focus on are as follows.

We have typically six tracks, with six timeslots, adding up to 36 speakers, ideally. For a short -funded event we can cut this down to four tracks with five timeslots, adding upto 20 speakers. This also saves us money on number of rooms rented. We can go from a buffet to a boxed lunch, that costs about 6$-8$ per head. Since 30-40% of people who eat are speakers/sponsors and volunteers, that can significantly reduce my costs too. Given that my costs add up to approx. $800 (rental + insurance) + $1800 (food) + $400$ extra = $3000$ to run a decent event (that includes lunch fees). With less money than that, I would think very hard about doing it. I can, if I find a free location which means even fewer rooms and consequently fewer attendees, but hopefully will not need to. This number gives me a lot of relief when it comes to what to expect by way of funding. It is the same math that goes into what is needed to pull off a pre-con too – if the attendee count does not add up to paying for rooms, lunch, and a minimum of 20% leftover, we typically cancel as it is not worth the costs.

My costs in the ‘want’ bucket are significantly lower with each year because of the reusable inventory swag we have built over years. I would strongly encourage all organizers to invest in this, especially when your funding is good. I do not deny that there is a storage cost that may be involved. We are fortunate to have a volunteer store it at her home for us – but this might be hard for some people. It does, however, help you make your event as mobile as possible without depending on specific locations, and also significantly cuts down on your costs, while keeping up the good appearance of a professionally run event.

Statistics with TSQL and R: Chi Square Test

As I move on from descriptive and  largely univariate (one variable based) analysis of data into more multivariate data – one of the first data analysis tests that came to mind is the Chi Square Test. It is a very commonly used test to understand relationships between two variables that are largely categorical in nature. The Chi Square test is often used in clinical trials or experiments that have a before and after analysis of their subjects needed.

For my purpose I downloaded a dataset from here – this is a study of lung conditions and  respiratory illnesses among a group of children in Austria. There are many categories here of the conditions these kids were subject to.  I summarized the data for my chi square test – and I get a small dataset as below of kids who had a parent who smoked in the home and who were sick. So my two categorical variables are – parent who smoked and did not, and kids who are sick and not. The frequencies I pulled are as below –

Exposure Sick Notsick
YES 250 323
NO 401 575

I created a table as below and put the data into it.

CREATE TABLE [dbo].[Respdisease_summary](
 [Exposure] [varchar](5) NULL,
 [Sick] [decimal](18, 2) NULL,
 [Notsick] [decimal](18, 2) NULL
) ON [PRIMARY]

For any dataset to lend itself to the Chi Square test it has to fit the following conditions  –

1 Both  variables are categorical (in this case – exposure to smoking – yes/no, and health condition – sick/not sick are both categorical).
2 Researchers used a random sample to collect data.
3 Researchers had an adequate sample size.Generally the sample size should be at least 100.
4 The number of respondents in each cell should be at least 5.

My dataset appears to fit these conditions, so I proceeded with analysing the data. Step 1 :Now that I have the data , I need to come up with a statement of what am trying to establish by doing these tests. Or in other words , a hypothesis. In statistical terms the logic is the similar to ‘innocent until proven guilty’ . Or in other words, my hypothesis in this case is that there is no correlation between parents who smoke at home and kids who suffer respiratory illness. My goal is to find out if this is true with 95% certainity(another common standard is what percentage of certainity, also called level of confidence)

Step 2: Next, I need to come up with degrees of freedom for this grid of data. Degrees of freedom in a nutshell means how many cells/data elements are actually independant versus how many are dependant on the one or ones already filled. A detailed discussion on this concept can be found here. You don’t have to understand it in a lot of detail but just enough to use the simple formula –
DF = (# of rows – 1) * (# of columns – 1). In this case – it is (2-1)*(2-1) which is actually 1.

Step 3: I need to create a table of  expected values of illness, as opposed to exposed which we got from the data.By that I mean what would value be if the kid was not exposed to the condition – or if our hypothesis that there is no connection just happened to be true?

For each cell in my data, the expected value for each cell of data – is the (row total/sum of all cells)*column total for the cell. I know am using excel like terms here but it is only to make the concept simple. (It is very possible to do this in excel by the way, but am restricting my scope to TSQL and R).

Step 4: Once I get the table of exposed and expected – i need to compare both and arrive at the chi-square value – which is (square of sum (exposed-expected))/sum(expected). Whether I choose to do this on each cell or add all the exposed and expected cell values and calculate it once – really does not matter.

Step 5: After I get the value of chi squared – I can use a table to get the probability of the two variables being correlated, given this chi square value. If you use R it will do this additional step for you and give you the p-value, or probablity as it is called. With other tools you may have to use a calculator like here. If the p value <= 0.05 (which comes fsrom our 95% confidence interval), the value is statistically significant and the null hypothesis is valid. If not, as it is in our case – where the value is 0.3274 – there is no statistically significant correlation for the null hypothesis. So it is safe to conclude that the opposite may be true with 95 percent certainity.

Now, on to the 3 ways of achieving this :

TSQL – I have not used the most optimal T-SQL here. The goal is clarity and I have taken a very methodical step-by-step approach.

CREATE TABLE #expected 
 (Exposure varchar(5), sick decimal(18,4), notsick decimal(18, 4))
 INSERT INTO #expected
 SELECT 'Yes', (A.Row1Total/E.Totalkids)*B.Col1Total as ExpectedSick,
 (A.Row1Total/E.Totalkids) * c.Col2Total as ExpectedNotsick
 FROM 
 (SELECT sick+notsick AS Row1Total FROM [dbo].[Respdisease_summary] where exposure = 'Yes') as A,
 (SELECT sum(sick) AS Col1Total FROM [dbo].[Respdisease_summary]) as b,
 (SELECT sum(notsick) AS Col2Total FROM [dbo].[Respdisease_summary]) as c,
 (SELECT sum(sick) + sum(notsick) AS Totalkids FROM [dbo].[Respdisease_summary]) AS E

INSERT INTO #expected
 SELECT 'No', (D.Row2Total/E.Totalkids)*B.Col1Total
 , (D.Row2Total/E.Totalkids) * c.Col2Total
 FROM 
 (SELECT sum(sick) AS Col1Total FROM [dbo].[Respdisease_summary]) as b,
 (SELECT sum(notsick) AS Col2Total FROM [dbo].[Respdisease_summary]) as c,
 (SELECT sum(sick) + sum(notsick) AS Totalkids FROM [dbo].[Respdisease_summary]) AS E,
 (SELECT sick+notsick AS Row2Total FROM [dbo].[Respdisease_summary] WHERE exposure = 'No') as D

SELECT SQUARE(a.actual-b.expected)/b.expected FROM 
 (SELECT sum(sick+notsick) as actual FROM [dbo].[Respdisease_summary]) A,
 (SELECT SUM(sick+notsick) as expected FROM #expected) B

CREATE TABLE #chisquare 
 (Exposure varchar(5), sick decimal(18,4), notsick decimal(18, 4))

INSERT INTO #chisquare
 SELECT 'yes',square(A.actualsick-B.expectedsick)/B.expectedsick,square(C.actualnotsick-D.expectednotsick)/D.expectednotsick 
 FROM
 (SELECT sick as Actualsick FROM [dbo].[Respdisease_summary] where exposure = 'Yes') as A,
 (SELECT sick as Expectedsick FROM [dbo].[#expected] where exposure = 'Yes') as B,
(SELECT notsick as Actualnotsick FROM [dbo].[Respdisease_summary] where exposure = 'Yes') as C,
 (SELECT notsick as Expectednotsick FROM [dbo].[#expected] where exposure = 'Yes') as D

INSERT INTO #chisquare
 SELECT 'No',square(A.actualsick-B.expectedsick)/B.expectedsick,square(C.actualnotsick-D.expectednotsick)/D.expectednotsick 
 FROM
 (SELECT sick as Actualsick FROM [dbo].[Respdisease_summary] where exposure = 'No') as A,
 (SELECT sick as Expectedsick FROM [dbo].[#expected] where exposure = 'No') as B,
 (SELECT notsick as Actualnotsick FROM [dbo].[Respdisease_summary] where exposure = 'No') as C,
 (SELECT notsick as Expectednotsick FROM [dbo].[#expected] where exposure = 'No') as D

SELECT SUM(sick) + sum(notsick) As CHISQUARE FROM #chisquare

The result I got was as below – a chi square value of 0.9590. If I look up the calculator for this chi square value with 1 degree of freedom – I get a probability of 0.3274.

chisqtsql

R: It is with problems like this that you really get to appreciate the efficiency of R. Just two little steps, easy-peasy and you get all that went into those multiple lines of TSQL code.

#Install basic packages
install.packages("RODBC")
library(RODBC)
#Connect to server and retrieve data
cn <- odbcDriverConnect(connection="Driver={SQL Server Native Client 11.0};server=MALATH-PC\\SQL01;database=WorldHealth;Uid=sa;Pwd=<mypwd>")
data1 <- sqlQuery(cn, ' select Sick,Notsick from dbo.Respdisease_summary')
#Calculate the chi square value
chisqt<-chisq.test(data1[1:2,c("Sick","Notsick")],correct=FALSE)
chisqt

I get results as below – R neatly does the calculation of P-value too for us.

chisqr

3 R Code from within of TSQL. This is my favorite part. Now you can tap into what R does from within of TSQL itself with a few simple lines of code as below.

EXEC sp_execute_external_script
 @language = N'R'
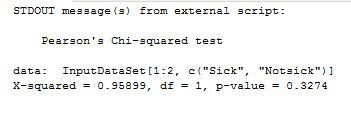
 ,@script = N'x<-chisq.test(InputDataSet[1:2,c("Sick","Notsick")], correct = FALSE);print(x)'
 ,@input_data_1 = N'SELECT Sick,Notsick FROM [WorldHealth].[dbo].[Respdisease_summary]'

And bingo, same results as 2.

chisqrtsql

There is a correction called Yates continuity correction that sometimes needs to be applied if our degrees of freedom is just one. R by default uses this coefficient which text book wise is jus t subtracting 0.5 from expected values. But for some reason I could not get the values to tie up using manual math/tsql and R upon usage of this, so I turned it off by saying ‘correct = False’ in R statement. It is also noteworthy that Chi SQuare test tells you nothing about the actual relationship between variables – it is only a test of independance and can tell you about degree of dependancy , that is all.


Statistics with T-SQL and R – the Pearson’s Correlation Coefficient

In this post I will attempt to explore calculation of a very basic statistic based on linear relationship between two variables. That is, a number that tells you if two numeric variables in a dataset are possibly correlated and if yes, by what degree. The Pearson’s coefficient is a number that attempts to measure this relationship.

The dataset I am using for this is downloaded from here. It is a dataset related to gender development index from various parts of the world. I am not using all the variables here. I am only attempting to examine if there is a correlation between average number of years in school, and gross national income, for women. Or in other words – Do women stay longer or shorter in schools because of income reasons? One important thing to be aware as we study this – is that correlation does not mean causation. By that – if I find a correlation between number of years women spend in school and the income, does not really mean the two are directly related. There may be many other factors influencing this relationship – or, after studying all the other factors we may very well conclude that there is not a significant relationship one way or the other. But, it is a starting point to see if there is any correlation between these two variables across countries.

The statistical definition of Pearson’s R Coefficient, as it is called, can be found in detail here for those interested. A value of 1 indicates that there is a strong positive correlation(the two variables in question increase together), 0 indicates no correlation between them, and -1 indicates a strong negative correlation (the two variables decrease together). But you rarely get a perfect -1, 0 or 1. Most values are fractional and interpreted as follows:
High correlation: .5 to 1.0 or -0.5 to 1.0.
Medium correlation: .3 to .5 or -0.3 to .5.
Low correlation: .1 to .3 or -0.1 to -0.3.

Now, let us look at calculation this value for the two variables we have chosen using R, then T-SQL and then R script within T-SQL.
Using R:

install.packages(“RODBC”)
library(RODBC)
mydata <- sqlQuery(cn, ‘select [FemaleMeanYearsofSchooling2014],
[GNAPerCapitaWomen2014]
FROM [WorldHealth].[dbo].[GenderDevelopmentIndex] WHERE [femalemeanyearsofschooling2014] >0 ‘)

cor(mydata)

corr-1

R creates a matrix out the two columns of data and correlates it four ways. I have only highlighted what is relevant to us – a value of 0.64, which suggests a moderately strong correlation.

The same calculation can be done with T-SQL. It is not as simple or elegant as it is in R, but it is very doable. To understand the formula read here. Although it is very possible to do this in one step, I have broken it up into 4 steps to help with clarity and understanding.

TSQL Code:

DECLARE @PART1 FLOAT, @PART2 FLOAT, @PART3 FLOAT, @PART4 FLOAT
SELECT @PART1 = SUM([FemaleSchoolingyears2014]*[GNAPerCapitaWomen2014])
FROM [dbo].[GenderDevelopmentIndex] where [FemaleSchoolingyears2014] > 0

SELECT @PART2 = (SUM([FemaleSchoolingyears2014])*SUM([GNAPerCapitaWomen2014]))/count(*)
FROM [dbo].[GenderDevelopmentIndex] where [FemaleSchoolingyears2014] > 0

SELECT @PART3 = SQRT(SUM([FemaleSchoolingyears2014]*[FemaleSchoolingyears2014])
– (SUM([FemaleSchoolingyears2014])*SUM([FemaleSchoolingyears2014]))/count(*))
FROM [dbo].[GenderDevelopmentIndex] where [FemaleSchoolingyears2014] > 0

SELECT @PART4 = SQRT(SUM([GNAPerCapitaWomen2014]*[GNAPerCapitaWomen2014])
– (SUM([GNAPerCapitaWomen2014])*SUM([GNAPerCapitaWomen2014]))/count(*))
FROM [dbo].[GenderDevelopmentIndex] where [FemaleSchoolingyears2014] > 0

SELECT ‘Pearsons correlation coefficient=’,ROUND((@PART1-@PART2)/(@PART3*@PART4), 2)

The results I get are as below:

cor-TSQL

So far, in both cases the value is a good 0.64. Now , instead of performing all this math in T-SQL we can call the R function to do it in one line, within T-SQL.

R call from within T-SQL:

EXEC sp_execute_external_script
@language = N’R’
,@script = N’ cor <-cor(InputDataSet$FemaleMeanYearsofSchooling2014,InputDataSet$GNAPerCapitaWomen2014);
print(cor);’
,@input_data_1 = N’select FemaleMeanYearsofSchooling2014,GNAPerCapitaWomen2014 FROM [WorldHealth].[dbo].[GenderDevelopmentIndex] where [FemaleSchoolingyears2014] > 0
;’;

My results are as below:

cor-r-tsql

As we can see, we got the same results in all 3 cases. The 0.64 correlation indicates the possibility of a moderately strong correlation between length of years women are in school and the GDP ratio of the country. It does not mean the GDP factor is the cause but merely a possibility. There is a old post authored by Joe Celko here that refers to the same calculation and can also help with conceptual understanding.

Thanks for reading.