As I move on from descriptive and largely univariate (one variable based) analysis of data into more multivariate data – one of the first data analysis tests that came to mind is the Chi Square Test. It is a very commonly used test to understand relationships between two variables that are largely categorical in nature. The Chi Square test is often used in clinical trials or experiments that have a before and after analysis of their subjects needed.
For my purpose I downloaded a dataset from here – this is a study of lung conditions and respiratory illnesses among a group of children in Austria. There are many categories here of the conditions these kids were subject to. I summarized the data for my chi square test – and I get a small dataset as below of kids who had a parent who smoked in the home and who were sick. So my two categorical variables are – parent who smoked and did not, and kids who are sick and not. The frequencies I pulled are as below –
| Exposure | Sick | Notsick |
| YES | 250 | 323 |
| NO | 401 | 575 |
I created a table as below and put the data into it.
CREATE TABLE [dbo].[Respdisease_summary](
 [Exposure] [varchar](5) NULL,
 [Sick] [decimal](18, 2) NULL,
 [Notsick] [decimal](18, 2) NULL
) ON [PRIMARY]
For any dataset to lend itself to the Chi Square test it has to fit the following conditions –
1 Both variables are categorical (in this case – exposure to smoking – yes/no, and health condition – sick/not sick are both categorical).
2 Researchers used a random sample to collect data.
3 Researchers had an adequate sample size.Generally the sample size should be at least 100.
4 The number of respondents in each cell should be at least 5.
My dataset appears to fit these conditions, so I proceeded with analysing the data. Step 1 :Now that I have the data , I need to come up with a statement of what am trying to establish by doing these tests. Or in other words , a hypothesis. In statistical terms the logic is the similar to ‘innocent until proven guilty’ . Or in other words, my hypothesis in this case is that there is no correlation between parents who smoke at home and kids who suffer respiratory illness. My goal is to find out if this is true with 95% certainity(another common standard is what percentage of certainity, also called level of confidence)
Step 2: Next, I need to come up with degrees of freedom for this grid of data. Degrees of freedom in a nutshell means how many cells/data elements are actually independant versus how many are dependant on the one or ones already filled. A detailed discussion on this concept can be found here. You don’t have to understand it in a lot of detail but just enough to use the simple formula –
DF = (# of rows – 1) * (# of columns – 1). In this case – it is (2-1)*(2-1) which is actually 1.
Step 3: I need to create a table of expected values of illness, as opposed to exposed which we got from the data.By that I mean what would value be if the kid was not exposed to the condition – or if our hypothesis that there is no connection just happened to be true?
For each cell in my data, the expected value for each cell of data – is the (row total/sum of all cells)*column total for the cell. I know am using excel like terms here but it is only to make the concept simple. (It is very possible to do this in excel by the way, but am restricting my scope to TSQL and R).
Step 4: Once I get the table of exposed and expected – i need to compare both and arrive at the chi-square value – which is (square of sum (exposed-expected))/sum(expected). Whether I choose to do this on each cell or add all the exposed and expected cell values and calculate it once – really does not matter.
Step 5: After I get the value of chi squared – I can use a table to get the probability of the two variables being correlated, given this chi square value. If you use R it will do this additional step for you and give you the p-value, or probablity as it is called. With other tools you may have to use a calculator like here. If the p value <= 0.05 (which comes fsrom our 95% confidence interval), the value is statistically significant and the null hypothesis is valid. If not, as it is in our case – where the value is 0.3274 – there is no statistically significant correlation for the null hypothesis. So it is safe to conclude that the opposite may be true with 95 percent certainity.
Now, on to the 3 ways of achieving this :
TSQL – I have not used the most optimal T-SQL here. The goal is clarity and I have taken a very methodical step-by-step approach.
CREATE TABLE #expected
 (Exposure varchar(5), sick decimal(18,4), notsick decimal(18, 4))
 INSERT INTO #expected
 SELECT 'Yes', (A.Row1Total/E.Totalkids)*B.Col1Total as ExpectedSick,
 (A.Row1Total/E.Totalkids) * c.Col2Total as ExpectedNotsick
 FROM
 (SELECT sick+notsick AS Row1Total FROM [dbo].[Respdisease_summary] where exposure = 'Yes') as A,
 (SELECT sum(sick) AS Col1Total FROM [dbo].[Respdisease_summary]) as b,
 (SELECT sum(notsick) AS Col2Total FROM [dbo].[Respdisease_summary]) as c,
 (SELECT sum(sick) + sum(notsick) AS Totalkids FROM [dbo].[Respdisease_summary]) AS E

INSERT INTO #expected
 SELECT 'No', (D.Row2Total/E.Totalkids)*B.Col1Total
 , (D.Row2Total/E.Totalkids) * c.Col2Total
 FROM
 (SELECT sum(sick) AS Col1Total FROM [dbo].[Respdisease_summary]) as b,
 (SELECT sum(notsick) AS Col2Total FROM [dbo].[Respdisease_summary]) as c,
 (SELECT sum(sick) + sum(notsick) AS Totalkids FROM [dbo].[Respdisease_summary]) AS E,
 (SELECT sick+notsick AS Row2Total FROM [dbo].[Respdisease_summary] WHERE exposure = 'No') as D

SELECT SQUARE(a.actual-b.expected)/b.expected FROM
 (SELECT sum(sick+notsick) as actual FROM [dbo].[Respdisease_summary]) A,
 (SELECT SUM(sick+notsick) as expected FROM #expected) B

CREATE TABLE #chisquare
 (Exposure varchar(5), sick decimal(18,4), notsick decimal(18, 4))

INSERT INTO #chisquare
 SELECT 'yes',square(A.actualsick-B.expectedsick)/B.expectedsick,square(C.actualnotsick-D.expectednotsick)/D.expectednotsick
 FROM
 (SELECT sick as Actualsick FROM [dbo].[Respdisease_summary] where exposure = 'Yes') as A,
 (SELECT sick as Expectedsick FROM [dbo].[#expected] where exposure = 'Yes') as B,
(SELECT notsick as Actualnotsick FROM [dbo].[Respdisease_summary] where exposure = 'Yes') as C,
 (SELECT notsick as Expectednotsick FROM [dbo].[#expected] where exposure = 'Yes') as D

INSERT INTO #chisquare
 SELECT 'No',square(A.actualsick-B.expectedsick)/B.expectedsick,square(C.actualnotsick-D.expectednotsick)/D.expectednotsick
 FROM
 (SELECT sick as Actualsick FROM [dbo].[Respdisease_summary] where exposure = 'No') as A,
 (SELECT sick as Expectedsick FROM [dbo].[#expected] where exposure = 'No') as B,
 (SELECT notsick as Actualnotsick FROM [dbo].[Respdisease_summary] where exposure = 'No') as C,
 (SELECT notsick as Expectednotsick FROM [dbo].[#expected] where exposure = 'No') as D

SELECT SUM(sick) + sum(notsick) As CHISQUARE FROM #chisquare
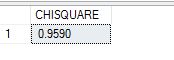
The result I got was as below – a chi square value of 0.9590. If I look up the calculator for this chi square value with 1 degree of freedom – I get a probability of 0.3274.
R: It is with problems like this that you really get to appreciate the efficiency of R. Just two little steps, easy-peasy and you get all that went into those multiple lines of TSQL code.
#Install basic packages
install.packages("RODBC")
library(RODBC)
#Connect to server and retrieve data
cn <- odbcDriverConnect(connection="Driver={SQL Server Native Client 11.0};server=MALATH-PC\\SQL01;database=WorldHealth;Uid=sa;Pwd=<mypwd>")
data1 <- sqlQuery(cn, ' select Sick,Notsick from dbo.Respdisease_summary')
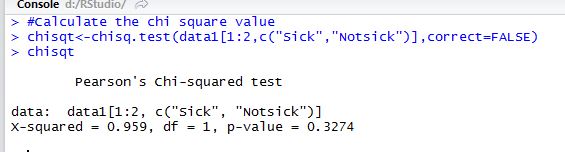
#Calculate the chi square value
chisqt<-chisq.test(data1[1:2,c("Sick","Notsick")],correct=FALSE)
chisqt
I get results as below – R neatly does the calculation of P-value too for us.
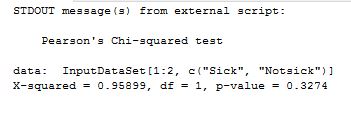
3 R Code from within of TSQL. This is my favorite part. Now you can tap into what R does from within of TSQL itself with a few simple lines of code as below.
EXEC sp_execute_external_script
 @language = N'R'
 ,@script = N'x<-chisq.test(InputDataSet[1:2,c("Sick","Notsick")], correct = FALSE);print(x)'
 ,@input_data_1 = N'SELECT Sick,Notsick FROM [WorldHealth].[dbo].[Respdisease_summary]'
And bingo, same results as 2.
There is a correction called Yates continuity correction that sometimes needs to be applied if our degrees of freedom is just one. R by default uses this coefficient which text book wise is jus t subtracting 0.5 from expected values. But for some reason I could not get the values to tie up using manual math/tsql and R upon usage of this, so I turned it off by saying ‘correct = False’ in R statement. It is also noteworthy that Chi SQuare test tells you nothing about the actual relationship between variables – it is only a test of independance and can tell you about degree of dependancy , that is all.

Very well done – I actually have my stats book from my classes at U of AZ in 1977. I’ve found several uses for Chi Square and R in the past decades, which answered the question, “Why do I need to know THIS?” Thank you for your efforts.
LikeLike
Thank you for your kind words. As a beginner into the R world (not new to stats) that is most encouraging.
LikeLike
Hi Mala, been appreciating your posts on SSC. Im new to R and replicate many of these examples for learning purposes. Im curious, how did you attain your matrix. I created a query (which I think is wrong) to insert into the Respdisease_summary table.
select
CASE WHEN raumu = 1 THEN ‘YES’ ELSE ‘NO’END,
CASE WHEN kehle = 0 THEN COUNT(kehle) ELSE 0 END,
CASE WHEN kehle = 1 THEN COUNT(kehle) ELSE 0 END
FROM atemwege
GROUP BY kehle, CASE WHEN raumu = 1 THEN ‘YES’ ELSE ‘NO’END
This may be the wrong way of going about it. I hear about a lot of data cleansing within R but I also see demos in TSQL.
Thank you!
LikeLike
I see you don’t monetize your website, don’t waste your
traffic, you can earn extra cash every month because you’ve got hi quality content.
If you want to know how to make extra $$$, search for: Boorfe’s tips best adsense alternative
LikeLike